This page was published under a previous government and is available for archival and research purposes.
Sulphur dioxide
Sulphur dioxide is a colourless gas that smells like burnt matches. It can also be oxidized in the atmosphere to form sulphuric acid aerosols. In addition, sulphur dioxide is a precursor to sulphates, one of the main components of airborne secondary PM2.5. Major sources of SO2 include smelters, industrial processes and electric utilities.
Health effects caused by exposure to high levels of SO2 include breathing problems, respiratory illness, and the exacerbation of respiratory and cardiovascular disease. People with asthma, chronic lung disease or heart disease are the most sensitive to SO2. Sulphur dioxide damages trees and crops. Similar to NO2, SO2 leads to the formation of PM2.5 and is also a precursor to acid rain, which contributes to the acidification of soils, lakes and streams, accelerated corrosion of buildings, and reduced visibility.
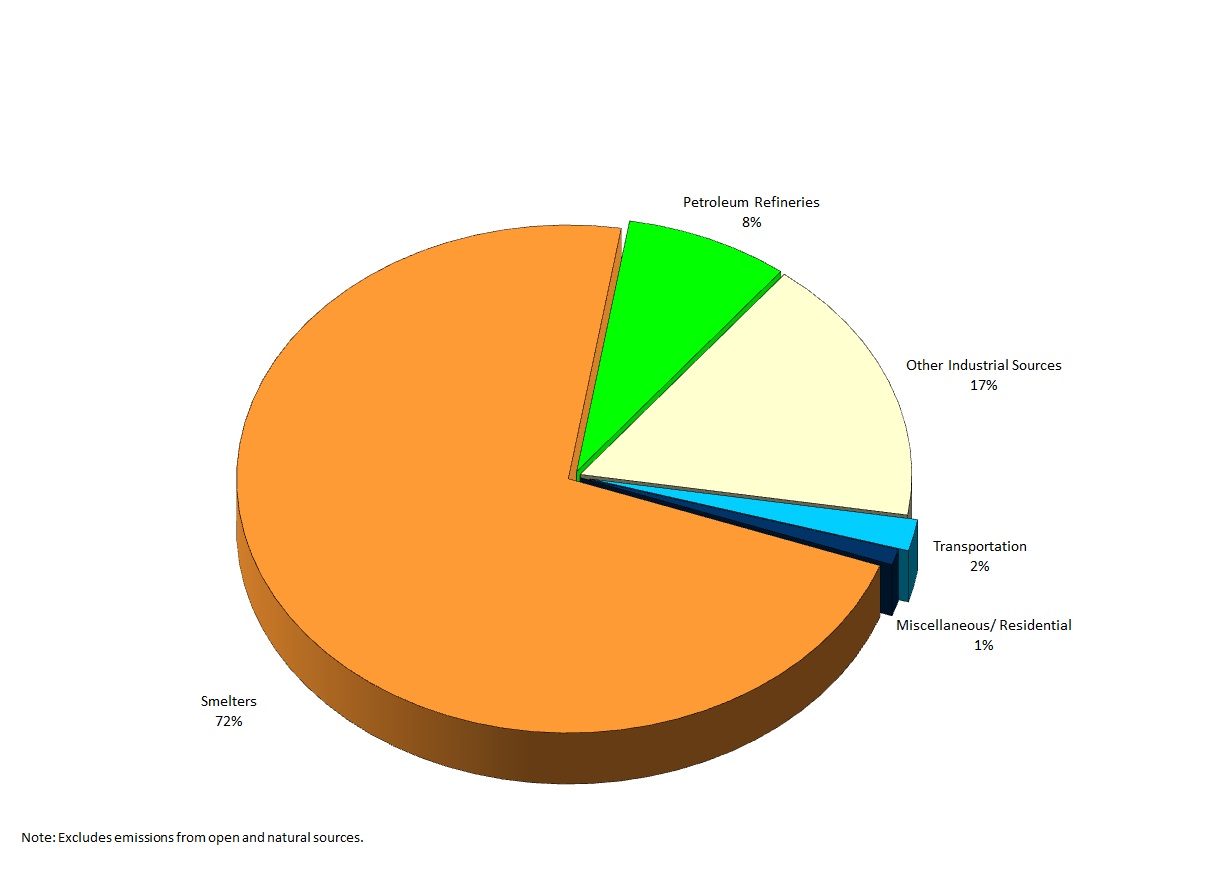
Smelters in central Ontario are the major sources of SO2 emissions in Ontario, accounting for approximately 72% of the provincial SO2 emissions according to 2016 estimates for point, area and transportation sources (excluding emissions from open and natural sources), as shown in Figure 15. Industrial processes (e.g. petroleum refining, cement and concrete manufacturing) accounted for an additional 25%. The transportation sector and miscellaneous sources accounted for the remaining 3% of all SO2 emissions in the province (Air Pollutant Emission Inventory 1990-2016, 2016).
There were no exceedances of the provincial one-hour, 24-hour and annual AAQC for SO2 of 250 ppb, 100 ppb and 20 ppb, respectively, at any of the ambient air monitoring locations in Ontario during 2016. Hamilton Downtown recorded the highest SO2 annual mean (3.2 ppb) during 2016, and the highest 24-hour maximum concentration (23 ppb) was recorded at Sudbury. Sudbury also recorded the highest one-hour maximum concentration (243 ppb) during 2016.
Figure 15: Ontario Sulphur Dioxide Emissions by Sector
(2016 Estimates for Point/Area/Transportation Sources)
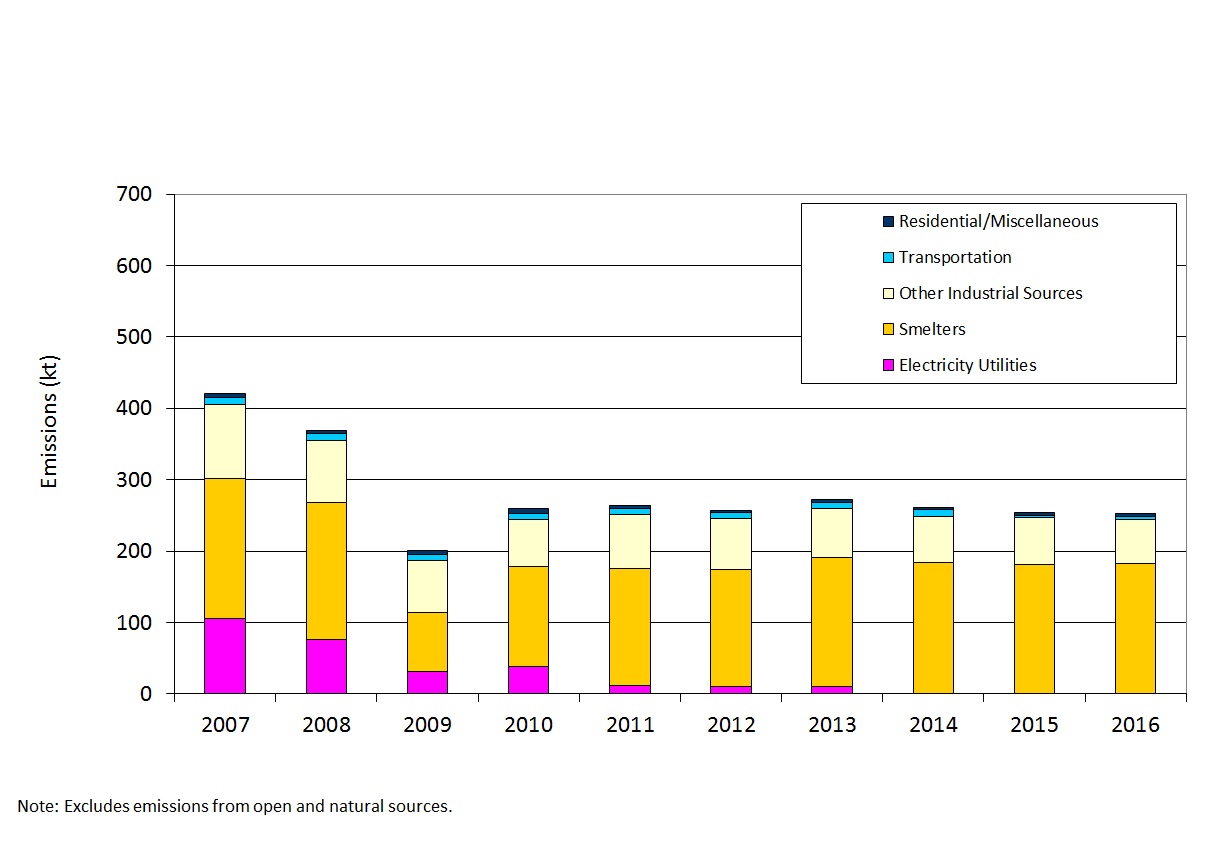
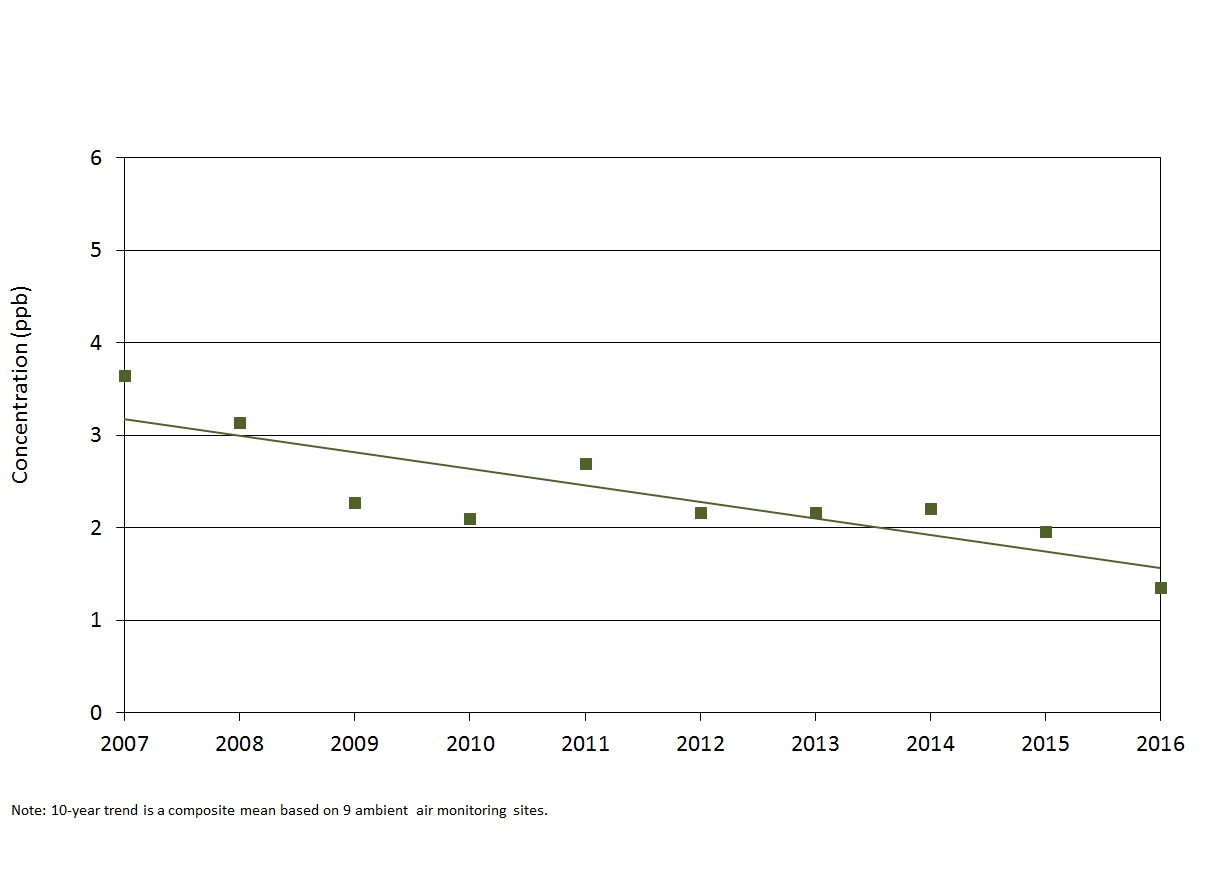
The SO2 annual mean concentrations from 2007 to 2016 show a decreasing trend of 51% across Ontario in Figure 16.Overall, provincial SO2 emissions have decreased by approximately 40% from 2007 to 2016 as shown in Figure 17 (Air Pollutant Emission Inventory 1990-2016, 2016). The reduction of SO2 emissions over the years is the result of various initiatives, which include, but are not limited to,
- Control orders for Ontario smelters;
- Countdown Acid Rain program and Canada-wide Acid Rain Strategy;
- Ontario emissions trading regulations on sulphur dioxide and nitrogen oxides (O. Reg. 397/01 and O. Reg. 194/05);
- Cessation of coal use in electricity generation; and
- Low sulphur content in transportation fuels.
Figure 16: Trend of SO2 Annual Means Across Ontario (2007-2016)
The NOx and SO2 Electricity Sector Emissions Trading Regulation, O.Reg. 397/01, placed limits on Ontario Power Generation’s (OPG) fossil fuel-fired generating stations starting in 2002. The Regulation was expanded in 2004 to also cover independent power producers. The primary goal of the program is to facilitate the cost-effective reduction of NOx and SO2 emissions through industry caps and incentives that reward innovation and voluntary action. Emissions from electricity generators covered by the program decreased by approximately 80% for NOx and 95% for SO2 between 2007 and 2016 (this was mostly the result of phasing out coal-fired electricity generation in the province).
The NOx and SO2 Emissions Trading for Industry Regulation, O.Reg. 194/05, includes large industrial emitters of NOx and SO2. Thirty facilities from seven industrial sectors are included in the program. Capped sectors include glass, petroleum refining, cement, iron and steel, pulp and paper, carbon black, and base metal smelting. Emissions from industry covered by the program decreased by approximately 30% for NOx and 30% for SO2 between 2007 and 2016.
Figure 17: Ontario SO2 Emission Trend (2007-2016)