Part B - Method ON-1: Location of Sampling Site and Sampling Points
Part B: Method ON-1: Location of Sampling Site and Sampling Points
1.0 Purpose
To determine sampling site and number of sampling points and their location based on stack or duct configuration.
2.0 Limitations
The basic method is not applicable in the following cases:
- cyclonic or swirling flow;
- reverse flow;
- stack or duct diameter less than 0.30 mor 0.071 m2 cross-section area;
- non-circular and non-rectangular stack or duct cross-section; and
- sampling site less than two (2) stack or duct diameters downstream from flow disturbance, or less than 0.5 stack diameter upstream from a disturbance.
3.0 Equivalent Diameter for Rectangular Cross-Sections
Equation 1-1
Equivalent diametre, De = (2LW) ⁄ (L + W)
Where:
- L
- length
- W
- width
Reference herein to “diameter” includes both diameter of a circular cross-section and equivalent diameter of a rectangular cross-section.
4.0 Location of Sampling Sites
The preferred location of the site is found in a straight, vertical length of stack or duct, close to the point of emission into the atmosphere, at least eight (8) diameters downstream and at least two (2) diameters upstream from any flow disturbance. Deviation from the preferred location is acceptable within the limitations and compensations stated in this method.
4.1 Circular Stacks and Ducts
For a stack or duct of circular cross-section, at least two sampling ports on the same cross-sectional plane separated by 90° (degrees) are required. Where applicable, the diameter passing through one port should be parallel to the centre line of an upstream flow disturbance and the other diameter should be perpendicular to this centre line.
4.2 Rectangular Stacks and Ducts
For a rectangular cross-section, determine the equivalent diameter and locate the ports on the most convenient face of the stack or duct. The number of ports corresponds to the number of traverses required to sample at the requisite number of points, as calculated below. The sampling ports should be located on the same cross-sectional plane.
5.0 Total Number of Sampling Points
5.1 Particulate Matter Traverses
For sampling sites which are located at least eight (8) diameters downstream and two (2) diameters upstream from a flow disturbance, the required minimum number of sampling points for a circular or rectangular cross-section is determined according to Tables 1-1 and 1-2.
5.1.1 Circular Cross-Sections
For sites with circular cross-sections, the total number of sampling points is divided evenly between two (2) traverses, the traverses being performed in directions perpendicular to each other.
5.1.2 Rectangular Cross-Sections
For sites with rectangular cross-sections, the equivalent diameter, De, is used as the diameter for the purposes of determining the minimum total number of sampling points.
When the number is determined from Table 1-1, it is compared to the values given for the total number of sampling points in Table 1-2 and, where necessary, the number is increased to the next greater value in Table 1-2. In the column titled “Number of Sampling Points per Traverse and Number of Traverses”, it is a matter of convenience as to which number represents traverses and which represents sampling points.
If the ratio of length to width of the cross-section is greater than 1.5, the layouts of Table 1-2 are not applicable. In that case the number of traverses and number of sampling points should be chosen such that their ratio most closely approximates the stack or duct dimensional ratio and provides at least the required minimum number of points.
In situations where the sampling sites are not located at least eight (8) diameters downstream and two (2) diameters upstream from a flow disturbance, the required minimum total number of sampling points is determined from Figure1-1.
- Determine the distances from the selected sampling site to the nearest upstream and downstream flow disturbances and divide each distance by the stack or equivalent diameter to determine the distance in terms of duct diameters.
- Determine the minimum total number of sampling points from Figure 1-1 for:
- the number of duct diameters upstream; and,
- the number of duct diameters downstream.
- Select the higher of the minimum numbers of traverse points from (a) and (b), or a greater value, so that for circular stacks or ducts the number is a multiple of four (4), and for rectangular stacks or ducts, the required number of sampling points corresponds to Table 1-2.
5.2 Velocity Traverses (Non-Particulate Matter)
When only velocity or volumetric flow rate is required to be determined, follow the procedures specified in Chapter 5.1 for particulate traverses, except that Figure 1-2 may be used instead of Figure 1-1. For determination of particulate matter emission rates and concentrations Figure 1-1 must be used.
6.0 Location of Sampling Points
Sampling points are located at the centroid of equal areas of the cross-section of the stack or duct.
6.1 Circular Stacks
For a circular cross-section, half of the total number of sampling points is located on each traverse, the spacing being determined by reference to Table 1-3 or the following equations in this subchapter.
An example of a grid of sampling points is shown in Figure 1-3. The values in Table 1-3 have been calculated from the following equations. These equations may be used to extrapolate the table.
For points from the port to centre:
Equation 1-2
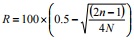
Equation 1-3
n = N ⁄ 2 + (1 − h)
For points from the centre to the far wall:
Equation 1-4
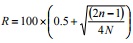
Equation 1-5
n = h − N ⁄ 2
Where:
- R
- percentage of stack or duct diameter from port
- h
- sampling point number (from port)
- N
- number of sampling points per traverse
6.2 Rectangular Stacks
For rectangular cross-sections, the area is divided into as many equal rectangular sections as there are sampling points. These rectangular sections are laid out according to the numbers in the right-hand column of Table 1-2 or as described in Chapter 5.1.2. Sampling points are located at the centroid of these areas.
For circular stacks with diameter greater than 0.61 m (2.0 ft), if a sampling point is located within 2.5 cm (1.0 in.) of a wall, it must be relocated a distance of 2.5 cm (1.0 in.) away from the wall. For stacks with diameter less than 0.6 m(2 ft), if a sampling point is located within 1.3 cm (0.5 in.) of a wall it must be relocated to a distance of 1.3 cm (0.5 in.) away from a stack wall or a distance equal to the inside diameter of the nozzle, whichever is greater. If a relocated point coincides with another sampling point then the sampling time is doubled at that point. It is assumed that this problem will not occur with rectangular cross-sections.
7.0 Cyclonic Flow Confirmation
The absence of cyclonic flow confirmation check is mandatory and must be performed for all sampling sites. The cyclonic flow confirmation check is conducted using the S-type Pitot tube and manometer described in Part C (Method ON-2) and employing the following procedure:
- Level and zero a manometer. Connect an S-type Pitot tube to the manometer;
- Position the S-type Pitot tube at a sampling point so that the planes of the face openings are parallel to the cross-sectional axis of the stack or duct;
- Rotate the Pitot tube (up to ±90°) about its longitudinal axis until the manometer reading (ΔP) is zero. Record the absolute value of the rotational angle to the nearest degree. If the Pitot tube does not have to be rotated to produce zero ΔP then a rotational angle of 0° is measured. Repeat this procedure for all sampling points in each traverse; and
- Calculate the arithmetic average of the recorded angles for each traverse; if the average is less than 15°, sampling may proceed as normal; if it is greater than 15°, then cyclonic flow is confirmed. If cyclonic flow is confirmed, refer to Appendix 1C for alternate procedure to follow.
8.0 Reverse Flow Confirmation
Reverse flow confirmation check is mandatory and must be performed for all sampling sites. Reverse flow is confirmed if, at any sampling site, there are one or more sampling points at which a negative velocity pressure head (ΔP) is found. If reverse flow is confirmed, refer to Appendix 1C for an alternate procedure to follow.
9.0 Discussion Of Method ON-1
9.1 Purpose
This method is used to ensure collection of representative samples of particulate matter and to measure stack gas velocities by the use of other methods described later. More particularly, procedures are described for determination of a preferred sampling site on the duct or stack and for determination of the total number of sampling points required at that site.
The procedures outlined here account for flow disturbances and various duct or stack configurations. Procedures are also provided to increase the number of sampling points where a non-ideal sampling site must be used. This method applies (within the stated limitations) to all stacks and ducts, vertical and horizontal, with circular or rectangular cross-sections.
9.2 Limitations
9.2.1 Cyclonic Flow
Cyclonic flow must be suspected in cases such as: after inline turbine fans, cyclones, inertial demisters following Venturi scrubbers, in stacks or ducts having tangential inlets or configurations which tend to induce swirling, among others.
The procedure in Chapter 7 on cyclonic flow configuration is followed to verify the absence of such flow. If cyclonic flow is found, the overall flow is indeterminate and Method ON-1 should not be applied.
9.2.2 Reverse Flow
Reverse flow must be suspected in cases where there is an obstruction in the stack or duct (e.g., baffle plates) upstream of the sampling site. If a negative velocity pressure head is detected, reverse flow is confirmed and Method ON-1 should not be applied.
9.2.3 Flow Disturbances
Flow disturbances in a stack or duct include: bends, constrictions, expansions, fans, turning vanes, air cleaning equipment, visible flames, hoppers, exits, etc. Beyond the stated limitations of this method, flow conditions may be indeterminate and collected data unreliable.
9.3 Location of Sampling Sites
In order to obtain a representative measurement of a flow parameter, the overall sampling conditions must be stable. This criterion can best be met when there is a steady and relatively uniform velocity profile. In order to achieve this profile, the effect of disturbances must be minimized.
The preferred site location is eight (8) or more diameters downstream from a disturbance and two (2) or more diameters upstream from a disturbance. It is assumed that the effects of the disturbances will be minimal at these distances. If a less than preferable location must be used, increasing the number of sampling points should result in collection of more accurate data.
Note: Sampling ports located at less than four (4) diameters downstream from a disturbance and/or less than one (1) diameter upstream from a disturbance are considered non-representative sampling locations. In the case that the minimum requirement cannot be met, stack extensions may be required. Alternatively, preliminary flow data may be submitted with the pre-test plan with the consultant’s rationale explaining how the stack gas characteristics (at this location) support the argument that it will allow for the collection of a representative sample.
A vertical stack is preferred, especially with respect to particulate matter sampling, since gravity could cause stratification of the particles at non-vertical sites. Traverses must be conducted in two (2) perpendicular directions of the same cross-sectional plane when testing at stacks or ducts with circular cross-sections.
Furthermore, one traverse should be parallel and the other perpendicular to the centerline of an upstream flow disturbance. These procedures are employed for two reasons:
- to determine the uniformity of the flow across the entire cross-sectional plane; and,
- to provide a more accurate measurement of the flow parameters.
10.0 Appendices to Method ON-1
10.1 Appendix 1A: Stack or Duct Diameter Less than 0.3 metres or Greater than 5.0 metres
Use of the standard sampling equipment in small diameter stacks or ducts presents obvious spatial difficulties. Altering the stack or duct by expanding its cross-sectional area may not be an adequate solution since the resulting flow velocity may be too low to be measured accurately.
10.1.1 Stack diameter less than 0.3 metres
In all cases where the stack or duct diameter between 0.1 m and 0.3 m(0.0078 m2 and 0.071 m2 in cross-sectional area, respectively), use Method 1A listed in the US EPA Title 40 of the Code of Federal Regulations, Part 60, Appendix A. For stacks or ducts with an internal diameter of less than 0.10 m, the Ministry’s Source Assessment Specialist should be contacted to discuss the matter.
10.1.2 Stack Diameter Greater than 5.0 metres
In the case of diameters larger than 5.0 m, the Ministry’s Source Assessment Specialist should be contacted in order to determine an acceptable number of sampling points.
Extrapolation, based on Table 1-3, might indicate an unnecessarily large number of sampling points in some cases.
Some stacks or ducts may be so large that it is impossible to traverse the entire diameter with a commercially available probe. It may be necessary then to use four ports, equally spaced about the stack or duct, in the plane of the cross-sectional area of the sampling site. It may also be necessary to construct a probe which would be long enough to perform a whole or half traverse. In such cases, the Ministry’s Source Assessment Specialist should be contacted before any sampling procedure is finalized.
10.2 Appendix 1B: Sampling in Non-Circular, Non-Rectangular Stack or Duct Cross-Sections
In the case of a stack or duct with an elliptical cross-section the following procedure is used to determine the sampling site and sampling points:
- Determine the location of the sampling site and the number of sampling points per traverse according to the method, using the major axis as the diameter; an equal number of sampling points are used for the major and minor axes.
- For location of sampling points on the major axis, the following equation is used:
Equation 1-6
Y = A(2n − 1) ⁄ N
Where:
- Y
- distance from centre of elliptical cross-section to sampling point n
- n
- the number of a sampling point (the points being numbered from the centre outwards)
- N
- total number of sampling points per traverse
- A
- half the length of the major axis
- For location of sampling points on the minor axis, the following equation is used:
Equation 1-7
X = B(2n − 1) ⁄ N
Where:
- X
- distance from centre of elliptical cross-section to sampling point n
- n
- the number of a sampling point, the points being numbered from the centre outwards
- N
- total number of sampling points per traverse
- B
- half the length of the minor axis
Note: Equations 1-6 and 1-7 are used to calculate the location of pairs of sampling points equidistant from the centre.
Equivalent diameters of non-circular, non-rectangular and non-elliptical cross-section are obtained by calculating the ratio 4A/P, where A stands for area and P for perimeter.
10.3 Appendix 1C: Elimination of Cyclonic or Reverse Flow
In some cases it may be practical to eliminate cyclonic or reverse flow in the stack or duct. This may be accomplished by altering the stack or duct by removal of internal obstructions, relocation of the sampling site, installing stack extension, addition of straightening vanes, alteration of inlet configuration, etc.
The US EPA 40 CFR 60 Method 5D (Figure 5D-1) provides an example of flow straightening vanes. Note that any flow disturbance correction alternative must be coordinated with the plant engineer, as it might negatively affect the process.
If relocating the sampling site or flow disturbance correction alternatives are not practical to correct cyclonic flows, use the US EPA 40 CFR 60 Method 2F, which determines stack gas velocity and volumetric flow rate with three dimensional probes.
If stack or duct gas flow problems cannot be overcome, contact the Ministry’s Source Assessment Specialist to discuss possible solutions.
11.0 References
- Environment Canada, Reference Method EPS 1/RM/8, Reference Methods for Source Testing: Measurement of Releases of Particulates from Stationary Sources, December, 1993.
- Ministry of Environment and Energy, Province of Ontario, Source Testing Code, Version 2, Report # ARB-66-80, November 1980.
- United States Environmental Protection Agency, Code of Federal Regulations, Title 40, Part 60, Appendix A.
| Inside Diameter of Circular Stack or Duct or Equivalent Diameter (Metres) |
Minimum Number of Sampling Points per Test (Circular Duct) |
Minimum Number of Sampling Points per Test (Rectangular Duct) |
|---|---|---|
| 0.3 to 0.61 | 8 | 9 |
| > 0.61 | 12 | 12 |
| Number of Sampling Points | Number of Sampling Points per Traverse and Number of Traverses |
|---|---|
| 9 | 3 × 3 |
| 12 | 3 × 4 |
| 16 | 4 × 4 |
| 20 | 4 × 5 |
| 25 | 5 × 5 |
| 30 | 5 × 6 |
| 36 | 6 × 6 |
| 42 | 6 × 7 |
| 49 | 7 × 7 |
Table 1-3: Location of Traverse Points on Diameters of Cross-sections of Circular Stacks
| Traverse Point Number on a Diameter | Number of Traverse Points on a Diameter | |||||||||||
|---|---|---|---|---|---|---|---|---|---|---|---|---|
| 2 | 4 | 6 | 8 | 10 | 12 | 14 | 16 | 18 | 20 | 22 | 24 | |
| 1 | 14.6 | 6.7 | 4.4 | 3.3 | 2.5 | 2.1 | 1.8 | 1.6 | 1.4 | 1.3 | 1.1 | 1.1 |
| 2 | 85.4 | 25.0 | 14.7 | 10.5 | 8.2 | 6.7 | 5.7 | 4.9 | 4.4 | 3.9 | 3.5 | 3.2 |
| 3 | 75.0 | 29.5 | 19.4 | 14.6 | 11.8 | 9.9 | 8.5 | 7.5 | 6.7 | 6.0 | 5.5 | |
| 4 | 93.3 | 70.5 | 32.3 | 22.6 | 17.7 | 14.6 | 12.5 | 10.9 | 9.7 | 8.7 | 7.9 | |
| 5 | 85.3 | 67.7 | 34.2 | 25.0 | 20.1 | 16.9 | 14.6 | 12.9 | 11.6 | 10.5 | ||
| 6 | 95.6 | 80.6 | 65.8 | 35.5 | 26.9 | 22.0 | 18.8 | 16.5 | 14.6 | 13.2 | ||
| 7 | 89.5 | 77.4 | 64.5 | 36.6 | 28.3 | 23.6 | 20.4 | 18.0 | 16.1 | |||
| 8 | 96.7 | 85.4 | 75.0 | 63.4 | 37.5 | 29.6 | 25.0 | 21.8 | 19.4 | |||
| 9 | 91.8 | 82.3 | 73.1 | 62.5 | 38.2 | 30.6 | 26.1 | 23.0 | ||||
| 10 | 97.5 | 88.2 | 79.9 | 71.7 | 61.8 | 38.8 | 31.5 | 27.2 | ||||
| 11 | 93.3 | 85.4 | 78.0 | 70.4 | 61.2 | 39.3 | 32.3 | |||||
| 12 | 97.9 | 90.1 | 83.1 | 76.4 | 69.4 | 60.7 | 39.8 | |||||
| 13 | 94.3 | 87.5 | 81.2 | 75.0 | 68.5 | 60.2 | ||||||
| 14 | 98.2 | 91.5 | 85.4 | 79.6 | 73.9 | 67.7 | ||||||
| 15 | 95.1 | 89.1 | 83.5 | 78.2 | 72.8 | |||||||
| 16 | 98.4 | 92.5 | 87.1 | 82.0 | 77.0 | |||||||
| 17 | 95.6 | 90.3 | 85.4 | 80.6 | ||||||||
| 18 | 98.6 | 93.3 | 88.4 | 83.9 | ||||||||
| 19 | 96.1 | 91.3 | 86.8 | |||||||||
| 20 | 98.7 | 94.0 | 89.5 | |||||||||
| 21 | 96.5 | 92.1 | ||||||||||
| 22 | 98.9 | 94.5 | ||||||||||
| 23 | 96.8 | |||||||||||
| 24 | 98.9 | |||||||||||
Figure 1-1: Minimum Number of Traverse Points for Particulate
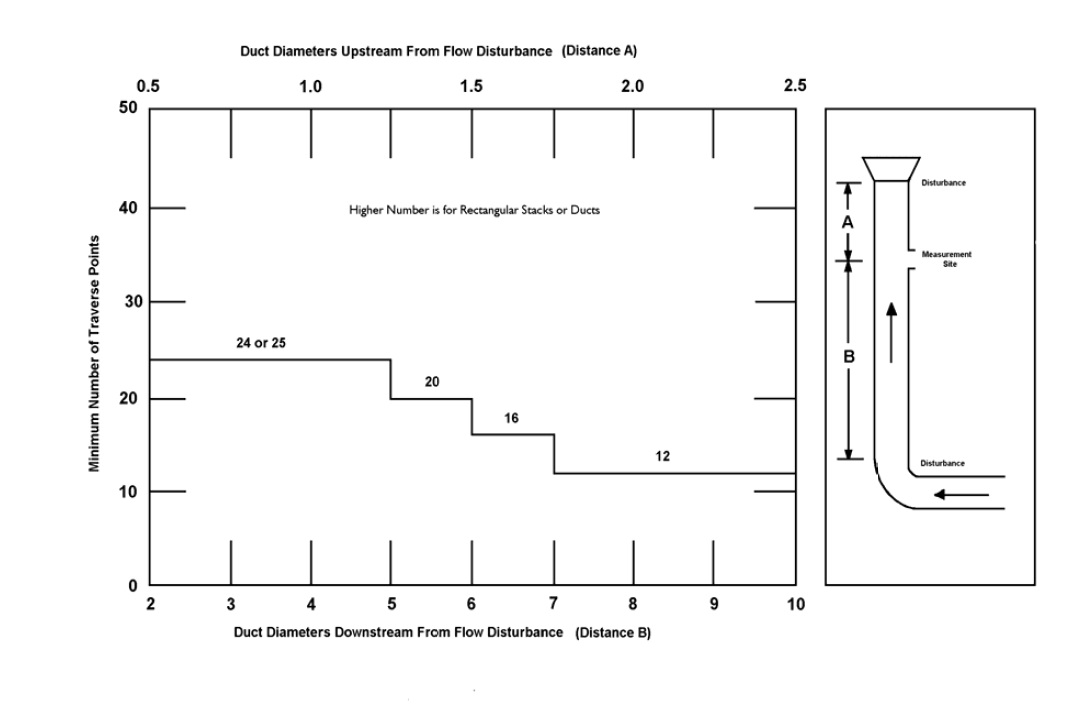
This graph illustrates how one derives the appropriate minimum number of traverse points when sampling particulate matter.
The number of traverse points is dependent on Distance A and Distance B. Distance A and B are represented by a figure adjacent to the graph. The figure is a schematic drawing of a duct that is being sampled following a ninety degree bend or any other flow disturbance. Distance B is the length of the duct following the disturbance to the measurement site and distance A is the upstream length from the exhaust point to the measurement site. Distance B is several times the length of distance A which allows for the distribution of the flow field following the disturbance to fully develop prior to sampling.
The bottom x-axis of the graph is titled Duct Diameters Downstream from Flow Disturbance (Distance B) and ranges from 2 to 10 in increments of one. The top x-axis of the graph is titled Duct Diameters Upstream from Flow Disturbance (Distance A) and ranges from 0.5 to 2.5 in one quarter increments. The y-axis is Minimum Number of Traverse Points and ranges from 0 to 50 in increments of 10.
The minimum number of sampling points for particulate is 24 or 25 when Distance B is less than or equal to 5 and Distance A is less than or equal to 1.25. The minimum number of sampling points is 20 when Distance B is greater than 5 and less than or equal to 6 and Distance A is greater than 1.25 and less than or equal to 1.5. The minimum number of sampling points is 16 when Distance B is greater than 6 and less than or equal to 7 and Distance A is greater than 1.5 and less than or equal to 1.75. The minimum number of sampling points is 12 when Distance B is greater than 7 and Distance A is greater than 1.75.
Figure 1-2: Minimum Number of Traverse Points for Velocity
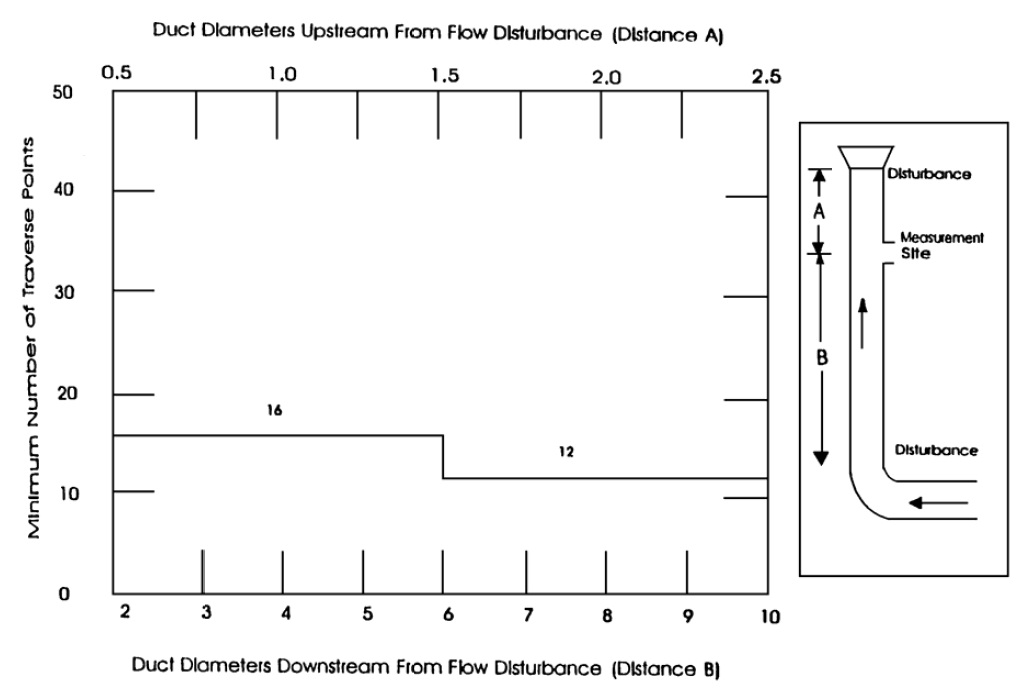
This graph illustrates how one derives the appropriate minimum number of traverse points when sampling for velocity.
The number of traverse points is dependent on Distance A and Distance B. Distance A and B are represented by a figure adjacent to the graph. The figure is a schematic drawing of a duct that is being sampled following a ninety degree bend or any other flow disturbance. Distance B is the length of the duct following the disturbance to the measurement site and distance A is the upstream length from the exhaust point to the measurement site. Distance B is several times the length of distance A which allows for the distribution of the flow field following the disturbance to fully develop prior to sampling.
The bottom x-axis of the graph is titled Duct Diameters Downstream from Flow Disturbance (Distance B) and ranges from 2 to 10 in increments of one. The top x-axis of the graph is titled Duct Diameters Upstream from Flow Disturbance (Distance A) and ranges from 0.5 to 2.5 in one quarter increments. The y-axis is Minimum Number of Traverse Points and ranges from 0 to 50 in increments of 10.
The minimum number of sampling points for velocity is 16 when Distance B is less than or equal to 6 and Distance A is less than 1.5. The minimum number of sampling points for velocity is 12 when Distance B is greater than 6 and Distance A is greater than 1.5.
Figure 1-3: Location of Traverse Points on Circular and Rectangular Cross-Sections Divided into 12 Equal Areas
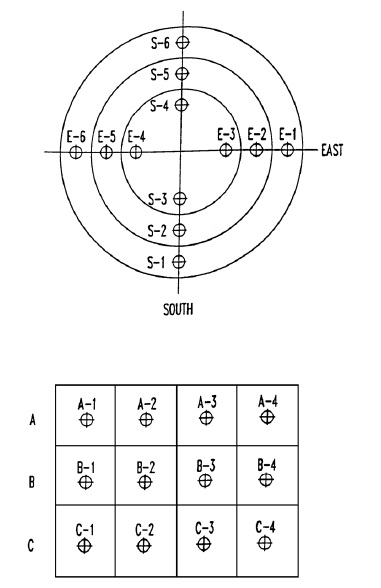
This figure illustrates the distribution and location of traverse points in a stack or duct on circular and rectangular cross-sections divided into 12 equal areas.
In a circular duct, twelve sampling points are depicted on the same plane at a vertical and horizontal cross section. Three points labelled S1, S2, and S3, are located on the vertical line below the horizontal line. Three points labelled S4, S5, and S6 are located on the vertical line above the horizontal line. Three points labelled E1, E2, and E3, are located on the horizontal line to the right of the vertical. Three points labeled E4, E5, and E6 are located on the horizontal line to the left of the vertical.
In a rectangular duct twelve sampling points are depicted in three rows of equal height in the vertical direction. Each row indicates four sampling points evenly spaced across the width of the duct in the horizontal direction.