Chapter 1: Demographic Trends and Projections 2024
Introduction
Over the next quarter century Ontario’s population is projected to grow substantially, with wide-ranging implications for the economy and for the provision of public services. The demographic trends taking place in Ontario are in many ways different from those observed in other economically developed jurisdictions around the world. The province welcomes a comparatively much higher number of international migrants each year than other jurisdictions, resulting in a faster pace of population growth. The young migrants settling in the province keep the working-age population growing and contribute to slowing the aging of the population. However, since most new international migrants settle in metropolitan areas, there is a dichotomy in the demographic outlook between regions of the province.
Ontario’s demographic outlook features the following long-term trends:
- Continued rapid increase in population;
- Population growth driven by immigrants and non-permanent residents;
- Concentration of population growth in metropolitan areas; and
- Increase in the number of seniors and aging within the 65+ age group;
The demographic outlook reflects the latest population projections published by the Ontario Ministry of Finance.
Ontario’s Demographic Outlook: Four Long-Term Trends
i. Continued Rapid Increase in Population
Since 1971, Ontario’s population has doubled. Between 1971 and 2023, the provincial population grew from 7.8 million to 15.6 million, increasing at an average pace of 1.3 per cent, or 149,000 annually. Ontario’s share of the Canadian population also rose, from 35.7 per cent in 1971 to 38.9 per cent in 2023.
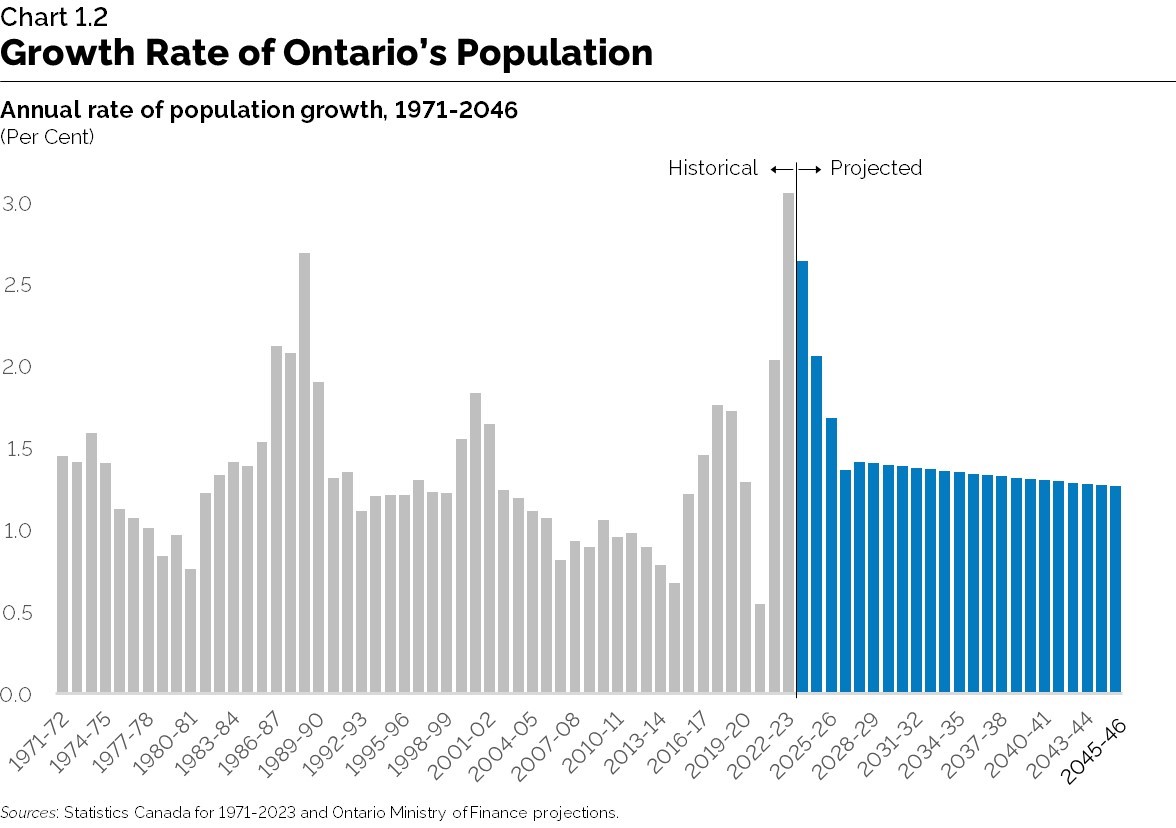
Provincial population growth has accelerated in recent years, recording increases of 303,000 (2.0 per cent) in 2021-22, and 463,000 (3.1 per cent) in 2022-23. This is much faster than the average annual growth of 158,000 (1.1 per cent) observed in the preceding decade (2011 to 2021), and faster than most other jurisdictions. The population of the province grew faster due to increased immigration and a rapidly growing number of non-permanent residents.

Ontario’s population is projected to continue growing rapidly in the short term, but at a moderating pace, increasing by 413,000 (2.6 per cent) in 2023-24, 331,000 (2.1 per cent) in 2024-25, and 276,000 (1.7 per cent) in 2025-26. The declining pace of population growth to 2026 reflects a projected return to more normal annual increases in the number of non-permanent residents compared to the record-breaking growth currently taking place.
After 2026 and in the long term, Ontario’s population is projected to continue experiencing significant growth driven by immigration. The pace of increase in the provincial population is projected to decline marginally in the long term, from 1.4 per cent in 2026–27 to 1.3 per cent by 2045–46. However, the corresponding annual growth in number of people is projected to increase gradually over time, from 227,000 in 2026–27 to 271,000 annually by 2045–46. The provincial population is projected to rise from 15.6 million in 2023 to 21.7 million in 2046. This represents an increase of 6.1 million (39 per cent) over the next 23 years.
ii. Population Growth Driven by Immigrants and Non-Permanent Residents
The share of annual population growth coming from natural increase, which is births minus deaths, has been declining over the last 50 years. Low fertility rates, an aging population and rising international migration have resulted in an increasing contribution of net migration to provincial population growth. Net migration in Ontario is the sum of all provincial migration inflows minus outflows during a given time period, including both international and interprovincial migrants.
In the 1970s, about one third of population growth was coming from net migration and two thirds from natural increase. The situation has now reversed. Over the 10 years preceding the COVID-19 pandemic, natural increase accounted for 28 per cent of population growth in Ontario, and net migration for 72 per cent.
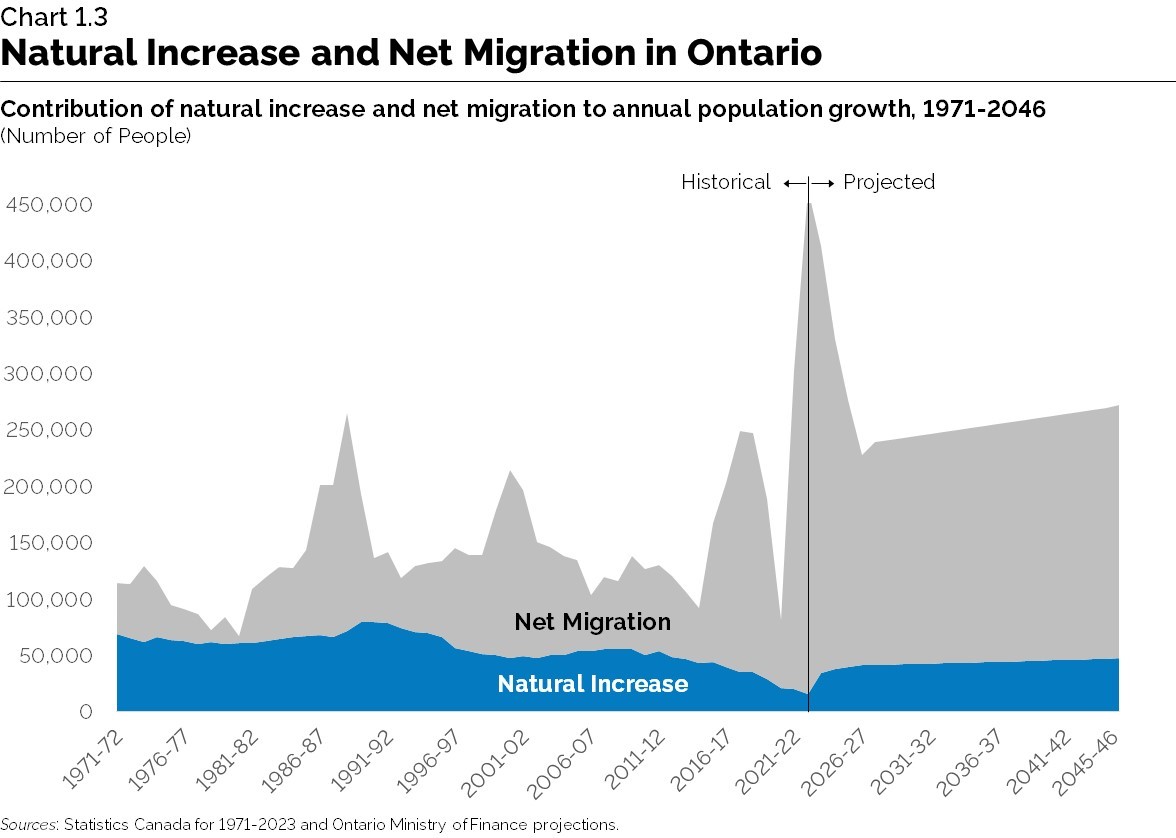
This trend is expected to continue over the projection period to 2046, as fertility rates are forecasted to remain low and the population to continue aging. Natural increase is projected to account for 17 per cent of Ontario’s population growth over the projection period to 2046, with net migration remaining the main source of population growth (83 per cent).
International migration is by far the main driver of net migration. While interprovincial migration with the rest of the country fluctuates between periods of net gains and net losses, by contrast international migration provides a relatively steady inflow of young migrants. Immigration is usually the largest component of net migration, but it has been exceeded by the net increase in the number of non-permanent residents in 2022-23.
Immigrants
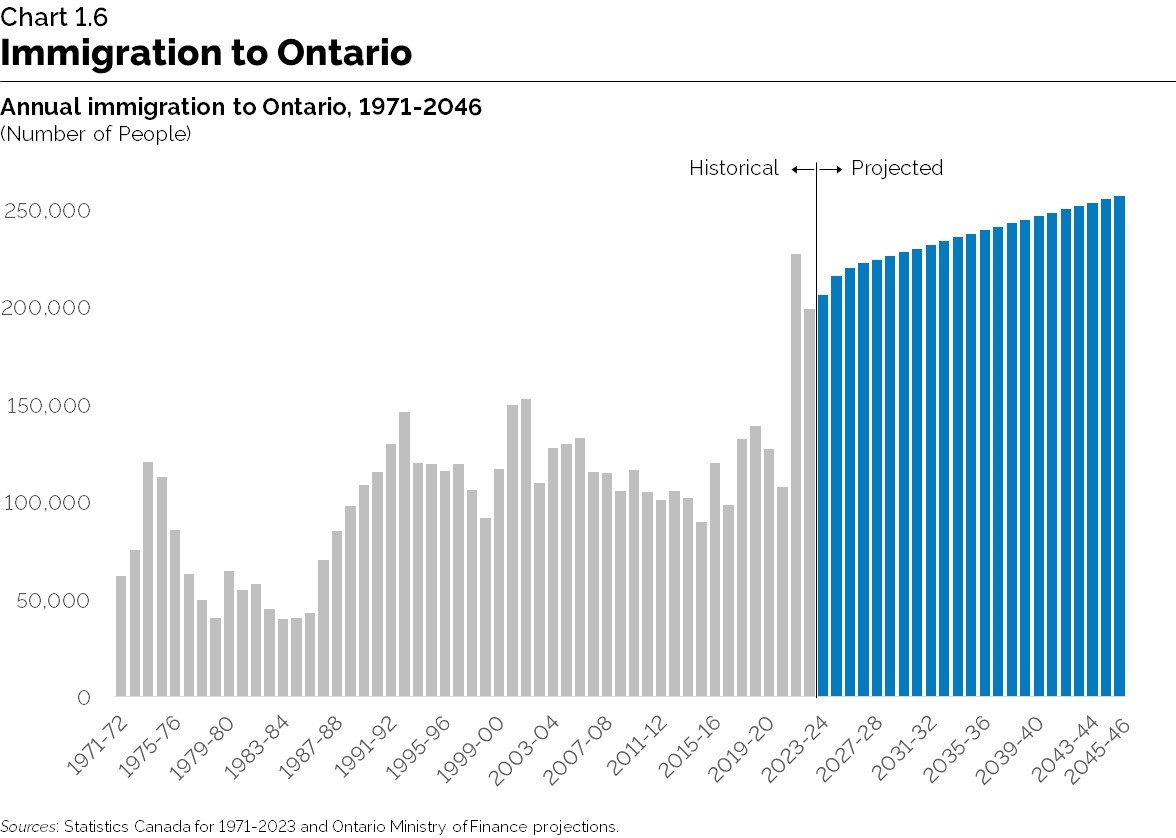
In 2022-23, 199,000 immigrants settled in Ontario, accounting for 43 per cent of all immigrants to Canada. This number of immigrants is more than the entire provincial population of Prince Edward Island (174,000), and more than the number of residents of the City of Burlington (194,000). This level of immigration is almost double that observed during the 2010s, when Ontario welcomed on average 112,000 immigrants per year.

Higher immigration levels to the province reflect the rapid increase in federal immigration targets for Canada over the past decade, which rose from 253,000 in 2013 to 465,000 in 2023. According to the federal plan, immigration levels to Canada are set to increase further to 500,000 by 2025, representing a near doubling of national immigration since 2013. This large jump in annual immigration targets is one of the main drivers of the significant long-term population growth projected for Ontario.
Over the projection horizon to 2046, annual immigration to Ontario is projected to remain strong and to increase gradually as the provincial population grows. Over 5.4 million new immigrants are projected to settle in Ontario over the next 23 years.

Non-Permanent Residents
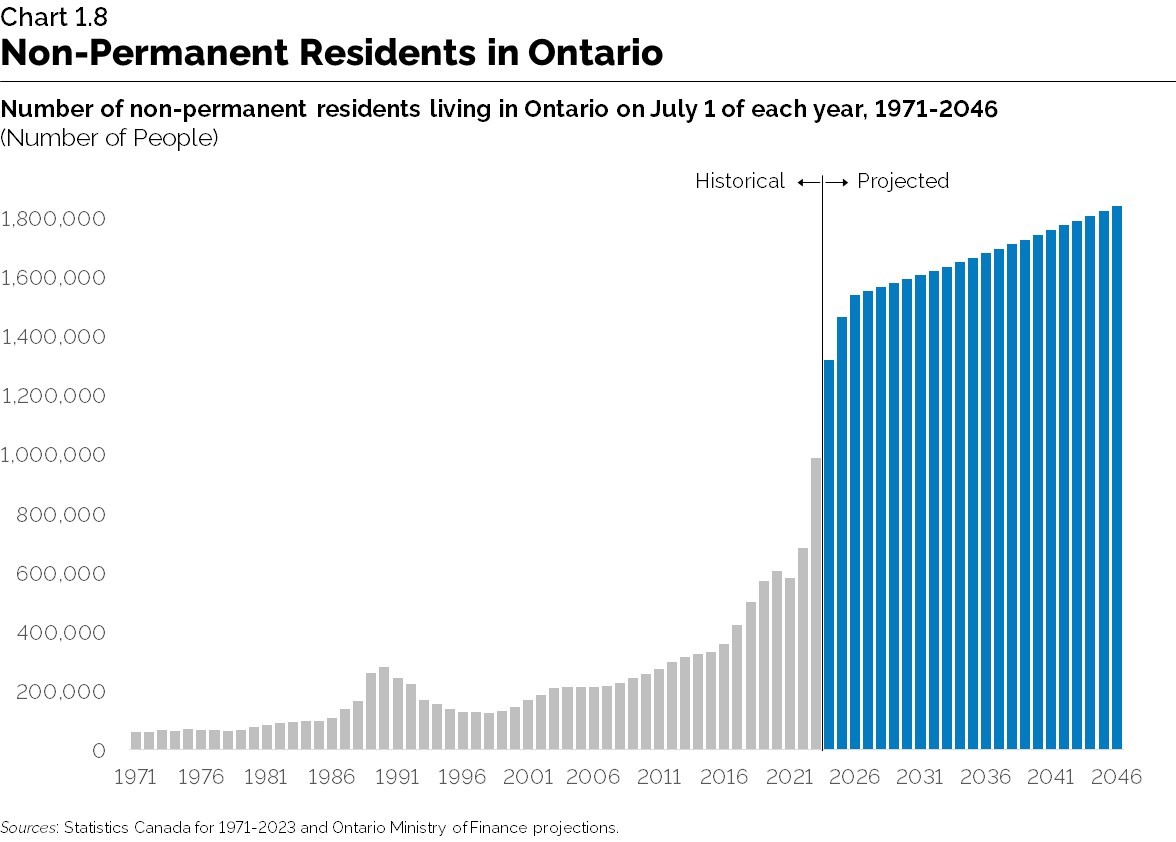
In 2022-23, the number of non-permanent residents living in Ontario rose from 682,000 to 987,000, a jump of 305,000, or 45 per cent in just 12 months. This record-breaking surge followed a net increase of 101,000 during 2021-22, which was also very high historically. In the past, the number of non-permanent residents living in the province was rising at a slower pace, averaging a net increase of 21,000 per year over the two decades to 2021.
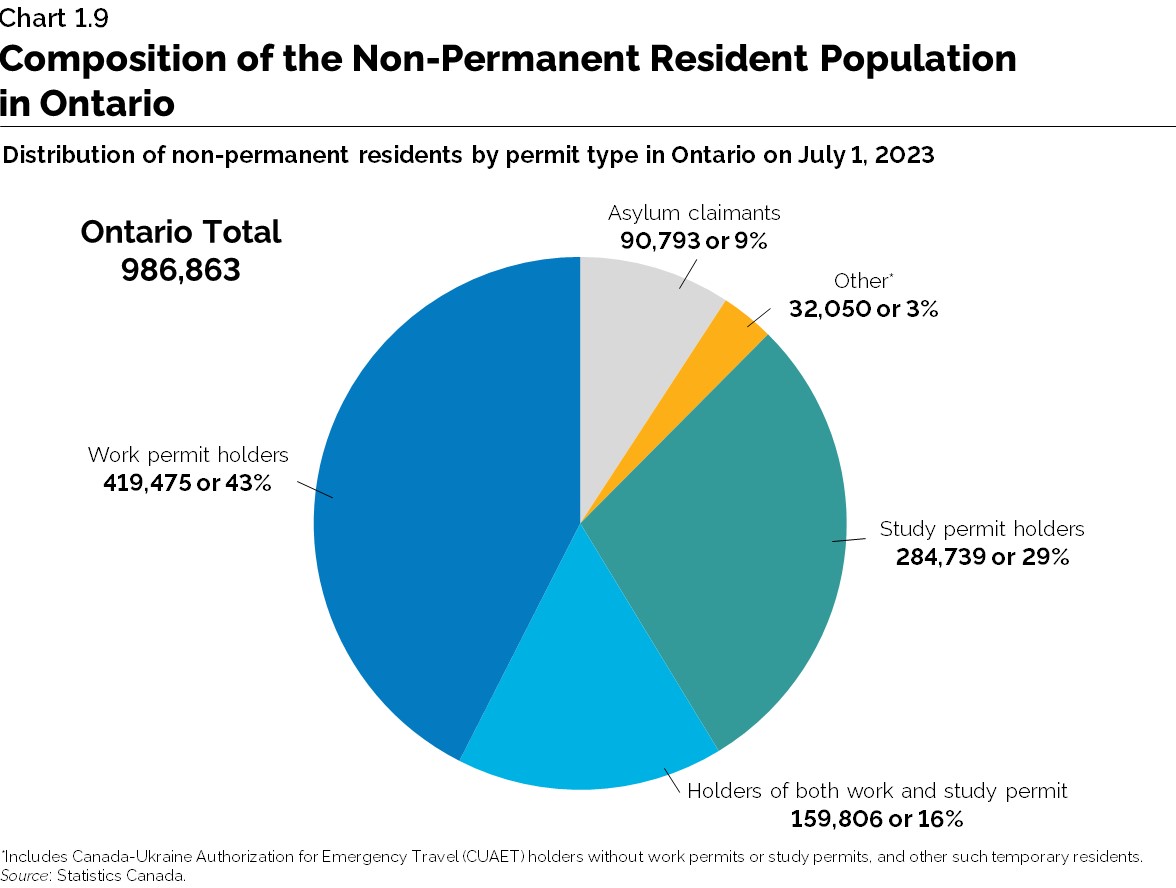
Most non-permanent residents in Ontario are holders of work or study permits, with a small proportion of asylum claimants (9 per cent) and other categories (3 per cent). The largest proportion consists of international students (45 per cent). About two thirds of these students hold a study permit only and one third hold both a study and a work permit.
Non-permanent residents who are holders of a work permit only account for 43 per cent of the total, but more than half of them relate in some way to the international student category, including post-graduation work permit holders, their spouses, and the spouses of current international students.
The rapid increase in the number of non-permanent residents before and after the pandemic has been driven by multiple factors, including:
- A changing immigration system increasingly targeting candidates with Canadian education credentials and work experience in Canada;
- High demand from prospective international students to study in Ontario;
- Increasing enrolment of international students at education institutions in Ontario;
- Ever-larger graduating cohorts of international students becoming eligible for post-graduation work permits;
- Increasing demand from employers to hire temporary foreign workers; and
- A surge in asylum seekers to Canada.
In addition, special measures for Ukraine have contributed to the latest increases. Since the end of March 2022, almost 300,000 Ukrainians have arrived in Canada under the Canada-Ukraine Authorization for Emergency Travel (CUAET), about half of whom have settled temporarily in Ontario.
Given the continued impact these drivers are set to have on the number of non-permanent residents in the province, net increases are projected to continue in the short-term, but at a decreasing pace. In early 2024, the federal government announced a two-year cap on admission of certain types of international students, along with other measures aimed at slowing the increase of the non-permanent resident population in Canada

iii. Concentration of Population Growth in Metropolitan Areas
Provincial population growth has increasingly been driven by international migration, and immigrants mostly settle in the Greater Toronto Area (GTA), while non-permanent residents also tend to live in large cities. This has resulted in relatively stronger population growth in the metropolitan areas of the province, particularly in the GTA and the census metropolitan areas (CMAs) of Southern Ontario.
While 18 per cent of Ontario’s population lives outside the 16 CMAs, only 7 per cent of provincial population growth over the last 20 years took place outside CMAs. From 2002 to 2022, the population living outside CMAs grew by 9 per cent or 222,000 residents. By contrast, the 16 CMAs added 2.8 million residents over those two decades, growing by 29 per cent. This dichotomy is projected to continue in the future.

In addition to fuelling population growth, the annual inflow of young international migrants to Ontario’s metropolitan areas has slowed down the aging of their populations. Since four out of five newcomers to Ontario are under the age of 40, regions selected by more international migrants currently have comparatively younger age structures.
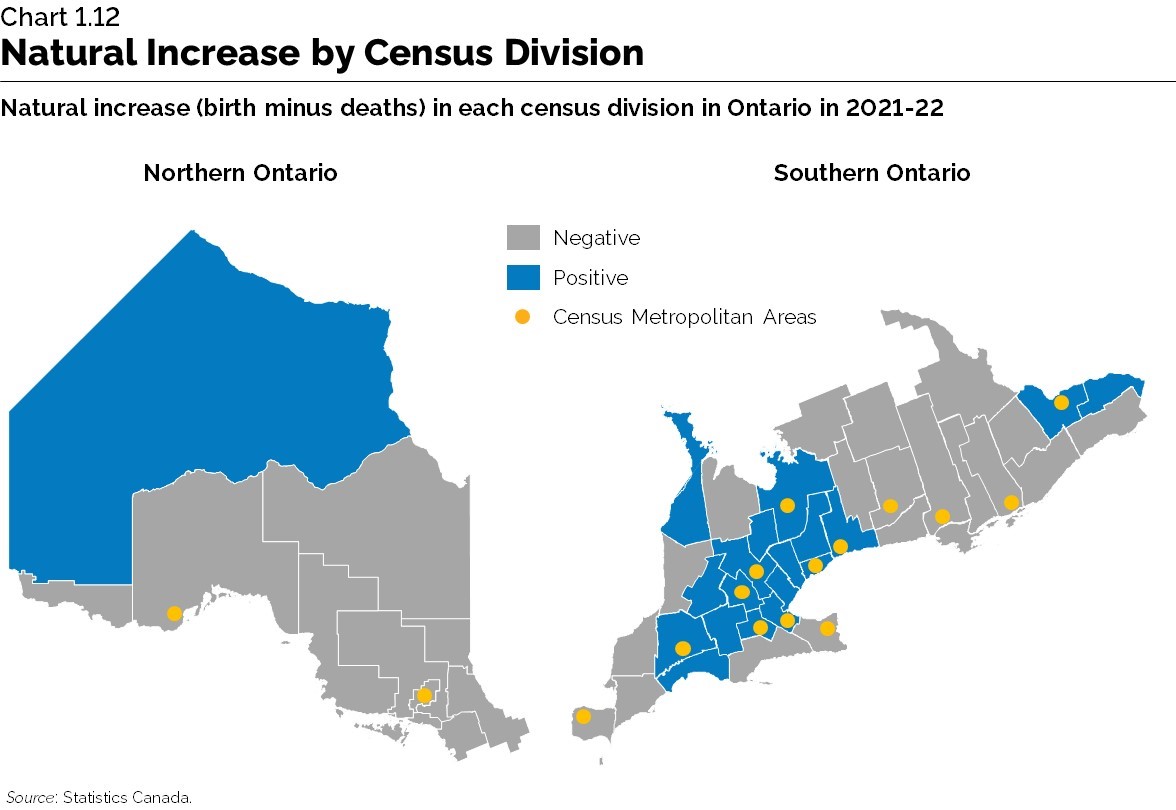
Due to their younger age structures, metropolitan areas are seeing a slower decline in their natural increase, compounding their relatively faster pace of migration-driven population growth. In 2021-22, only 19 of Ontario’s 49 census divisions were experiencing positive natural increase (more births than deaths), down from 30 census divisions 20 years ago. Most census divisions that continue to see more births than deaths are located in the Greater Golden Horseshoe.
This dichotomy in demographic trends over time among regions of the province has led to a concentration of population growth in Ontario’s metropolitan areas, a phenomenon that is projected to continue. Nevertheless, despite the older age structure in many rural and northern areas, population growth continues to take place in those regions, but at a slower pace than in metropolitan areas, driven by migrants from the rest of the province and some international migration. In 2021-22, all 49 census divisions experienced population growth, a trend that is also projected to continue to 2046.
Regional Demographic Outlook
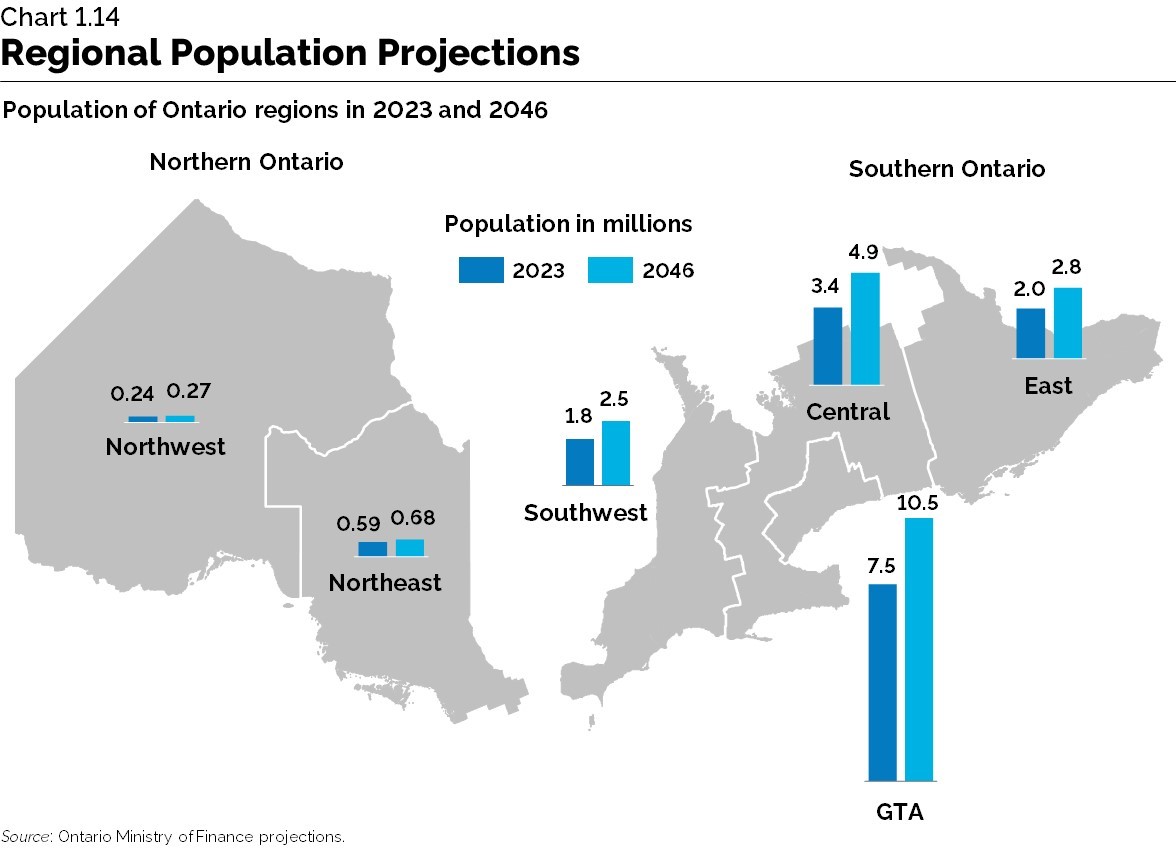
The GTA’s population is projected to grow by 41 per cent from 2023 to 2046, adding another 3.1 million people to reach 10.5 million residents. This is slightly faster growth than for the province as a whole (+39 per cent). The region is projected to account for over half of provincial population growth over the period. It is projected that 49 per cent of Ontarians will live in the GTA by 2046, up from 46 per cent in 2006 and 48 per cent in 2023.
Central Ontario, with seven of Ontario’s 16 CMAs, is projected to be the fastest-growing region of the province, with growth of 43 per cent, from a population of 3.4 million in 2023 to 4.9 million in 2046.
From 2023 to 2046, both Eastern and Southwestern Ontario are projected to experience population growth at about the same pace as the province as a whole. Eastern Ontario is projected to see population growth of 783,000, or 39 per cent over the period, from 2.0 million in 2023 to 2.8 million by 2046. The population of Southwestern Ontario is projected to grow by 665,000, or 36 per cent, from 1.8 million to 2.5 million.
Population growth trends for the North changed significantly over the past few years, driven by rapid growth in the number of non-permanent residents living in the region and more immigrants through the new Rural and Northern Immigration Pilot. The population of Northern Ontario is projected to increase by 104,000 or 12 per cent, from 837,000 in 2023 to 941,000 by 2046. Within the North, the Northeast is projected to see its population edging up by 83,000, or 14 per cent, from 593,000 to 676,000. The Northwest is also projected to experience slight population growth of 21,000 people, or 9 per cent, from 244,000 to 265,000.
iv. Increase in the Number of Seniors and Aging Within the 65+ Age Group
Population aging in Ontario is the result of low fertility rates and increasing life expectancies, compounded by the aging of the large cohorts of baby boomers. The pace of population aging in Ontario is slower than in many other developed jurisdictions, due to strong international migration to the province. Nevertheless, over the rest of the 2020s and the 2030s, the number of seniors is set to continue increasing rapidly. At the same time, the aging of baby boomers will result in an increasing proportion of older seniors within the 65+ age group.
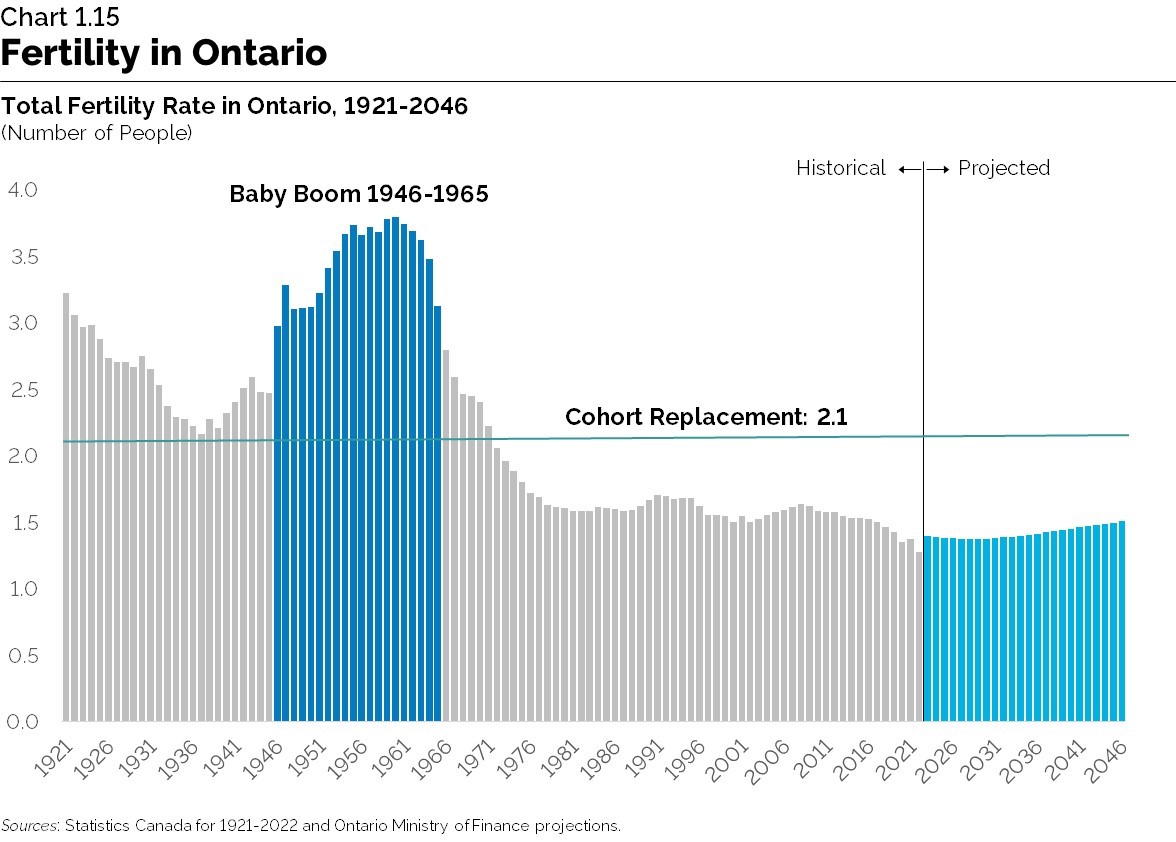
Baby boomers, born from 1946 to 1965, are now aged 59 to 78. The largest cohorts were born in the early 1960s, when Ontario’s total fertility reached a high of 3.8 children per woman. Following the baby boom, fertility rates declined rapidly over the rest of the 1960s and 1970s, falling below the cohort replacement level of 2.1 children per woman in 1972. From the late 1970s to the late 2000s, Ontario’s total fertility rate was fairly stable, hovering in a narrow band between 1.45 and 1.65. However, further declines have been observed over the last decade, down to 1.27 children per woman in 2022.
Fertility rates are not expected to return to the levels observed in the 1950s and early 1960s. The total fertility rate is assumed to increase slightly to 1.50 children per woman by 2046. Since fertility rates at younger ages have declined so much that they are now very low, there is less potential for them to show large additional declines in the future. At the same time, the fertility of women aged 30+ is likely to continue rising slowly, driving the slight projected increase in the total fertility rate.

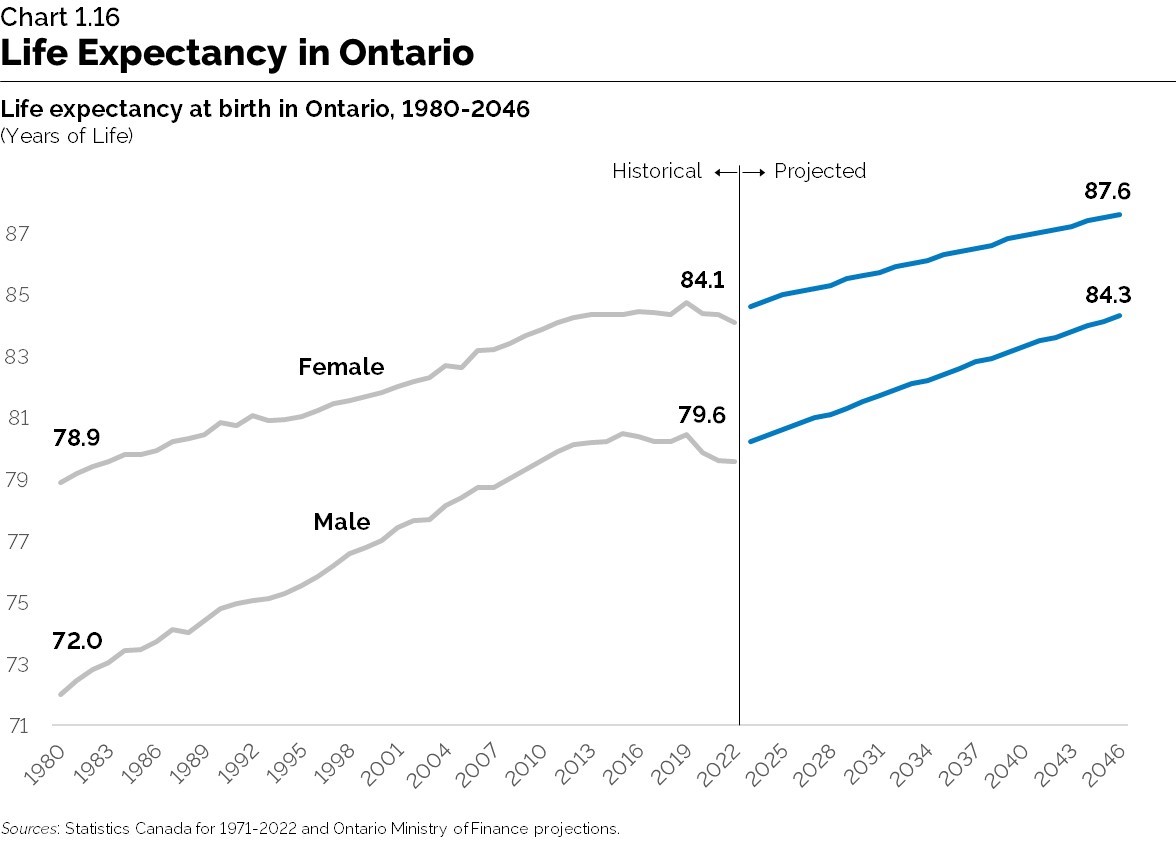
Increased longevity is also contributing to a larger share of seniors in the population. For instance, over the last 30 years, life expectancy at birth for Ontario men increased from 75.1 years in 1992 to 79.6 years in 2022, for a total gain of 4.5 years of life. The life expectancy at birth of Ontario women increased at a slower pace over the same period, with a total gain of 3.0 years of life, from 81.1 to 84.1 years.
Over the last few years, the pace of increase in longevity has slowed due to COVID-19, elevated mortality due to opioid overdoses, and smaller gains coming from improving heart disease survival. Nevertheless, life expectancy is projected to continue increasing in the future, but at a slower pace than in the past. The increase is projected to be driven by continuing gains in cancer survival rates. By 2046, life expectancy at birth is projected to reach 84.3 years for men and 87.6 years for women.
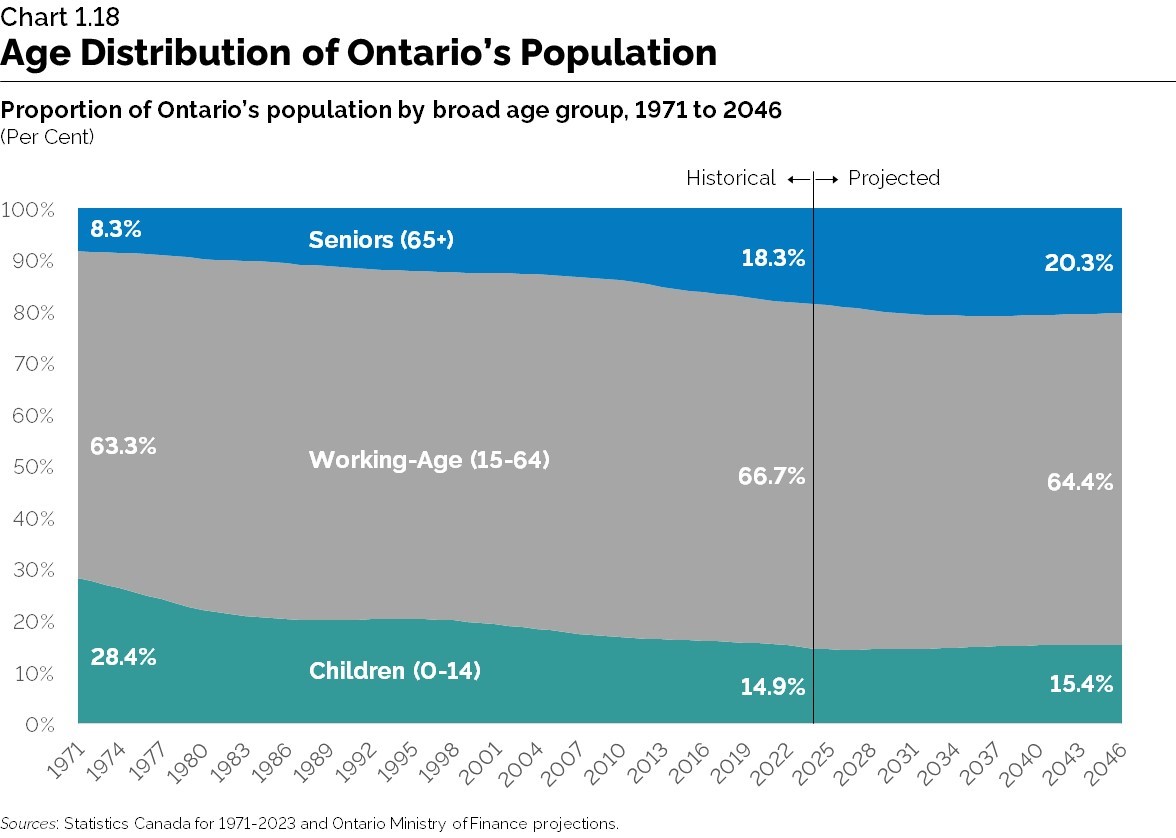
Over the last 50 years, the combination of falling fertility, increasing life expectancy, and aging of the baby boomers has resulted in population aging. In 2016, for the first time on record, the number of seniors aged 65+ in Ontario surpassed the number of children aged 0 to 14 years. Children now account for less than 15 per cent of Ontario’s population, down from 28 per cent in 1971. By contrast, the share of seniors in the provincial population is now at an all-time high of 18 per cent, up from 8 per cent in 1971.
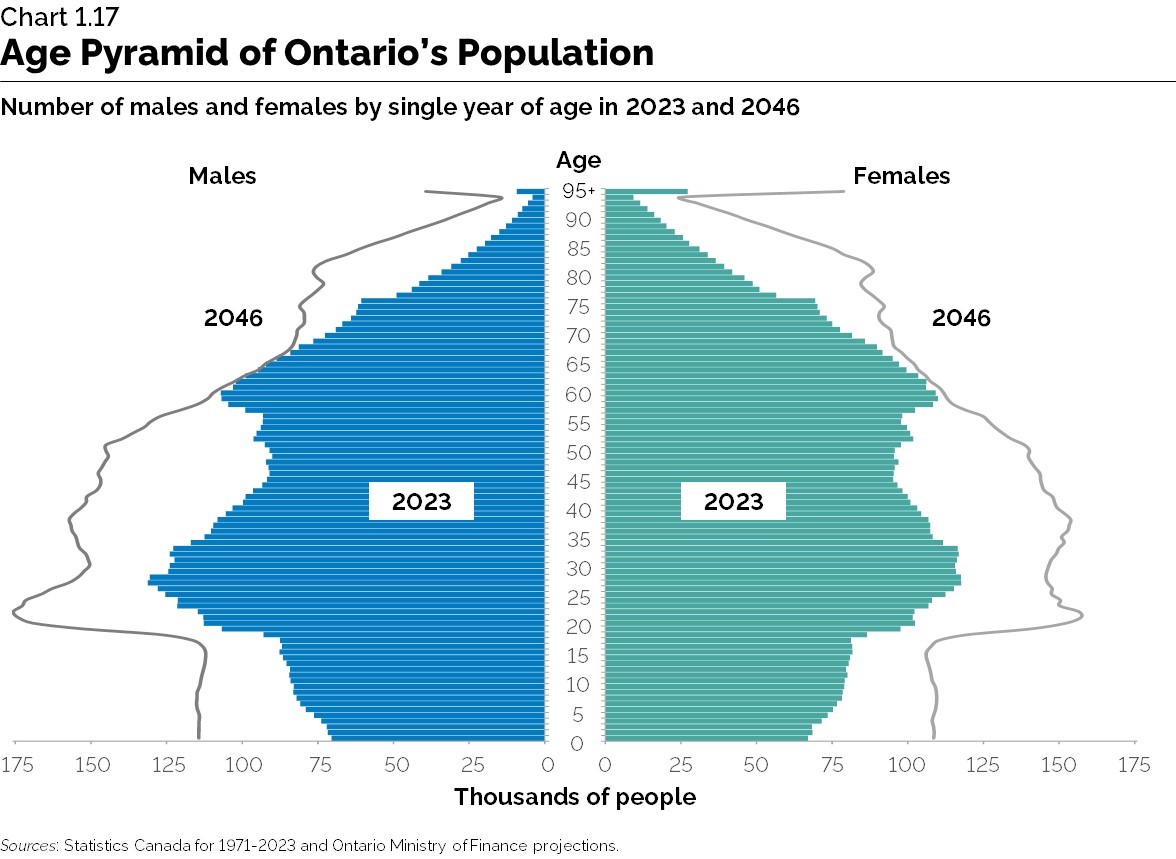
More recently, increasing levels of international migration have altered the age profile of Ontario’s population. Most notably, the largest age cohorts in the province are no longer those of the baby boom peak (now in their early 60s). In 2023, the largest age cohorts in Ontario were in their mid-20s and were composed of over one quarter non-permanent residents (see Chart 1.10) and a significant proportion of immigrants. New permanent residents (immigrants) will age over time like the rest of the population, eventually becoming seniors. However, the ever-increasing population of non-permanent residents in the province (1.5 million by 2026) will remain a revolving group of residents at younger ages. Their presence will help keep the age profile of the provincial population from aging as rapidly as in many other developed economies.
Age Profile Outlook for Ontario’s Population
Over the projection period to 2046, population aging is set to continue in Ontario, but at a slower pace than was observed over the past two decades.
The number of children aged 0 to 14 is projected to increase moderately over the projection period, from 2.3 million in 2023 to 3.3 million by 2046. The children’s share of population is projected to decrease initially from 14.9 per cent in 2023 to 14.4 per cent by 2026, followed by a slow increase to 15.4 per cent by 2046.
The number of Ontarians aged 15 to 64 is projected to increase from 10.4 million in 2023 to 14.0 million by 2046. This age group’s share of total population is projected to decline slowly for most of the projection period, from a peak of 66.9 per cent in 2024 to 64.0 per cent by 2038, and to increase slowly thereafter to reach 64.4 per cent by 2046. Overall, the proportion of Ontarians aged 15 to 64 is projected to remain higher than it was in the early 1970s.
The growth rate of the population aged 15 to 64 is projected to quickly trend lower initially, to an average of 0.8 per cent annually over the late 2020s, a pace of change similar to that observed over the 2010s. Thereafter, as the grandchildren of baby boomers reach age 15 and strong international migration continues, the pace of annual growth of the 15 to 64 age group is projected to accelerate, reaching 1.3 per cent in 2045–46.
The number of seniors aged 65+ is projected to increase significantly, from 2.9 million or 18.3 per cent of population in 2023, to 4.4 million, or 20.3 per cent by 2046. However, the projected increase in the share of seniors to 2046 will be much slower than that observed over the recent past. Since 2000, the share of seniors increased by 5.8 percentage points, compared to a projected increase of 1.9 percentage points between 2023 and 2046.
By the early 2030s, once all baby boomers have reached age 65, the growth in the number of seniors will slow significantly. The share of seniors is projected to reach a peak at 20.9 per cent in 2036. The annual growth rate of the senior age group is projected to slow from an average of 3.1 per cent over 2023–31 to 1.0 per cent by the end of the projection period.
The older age groups will experience the fastest growth among seniors. The number of people aged 75 and over is projected to double in size, from 1.3 million in 2023 to 2.6 million by 2046. The number of people in the 90+ group will almost triple, from 143,000 to 417,000.
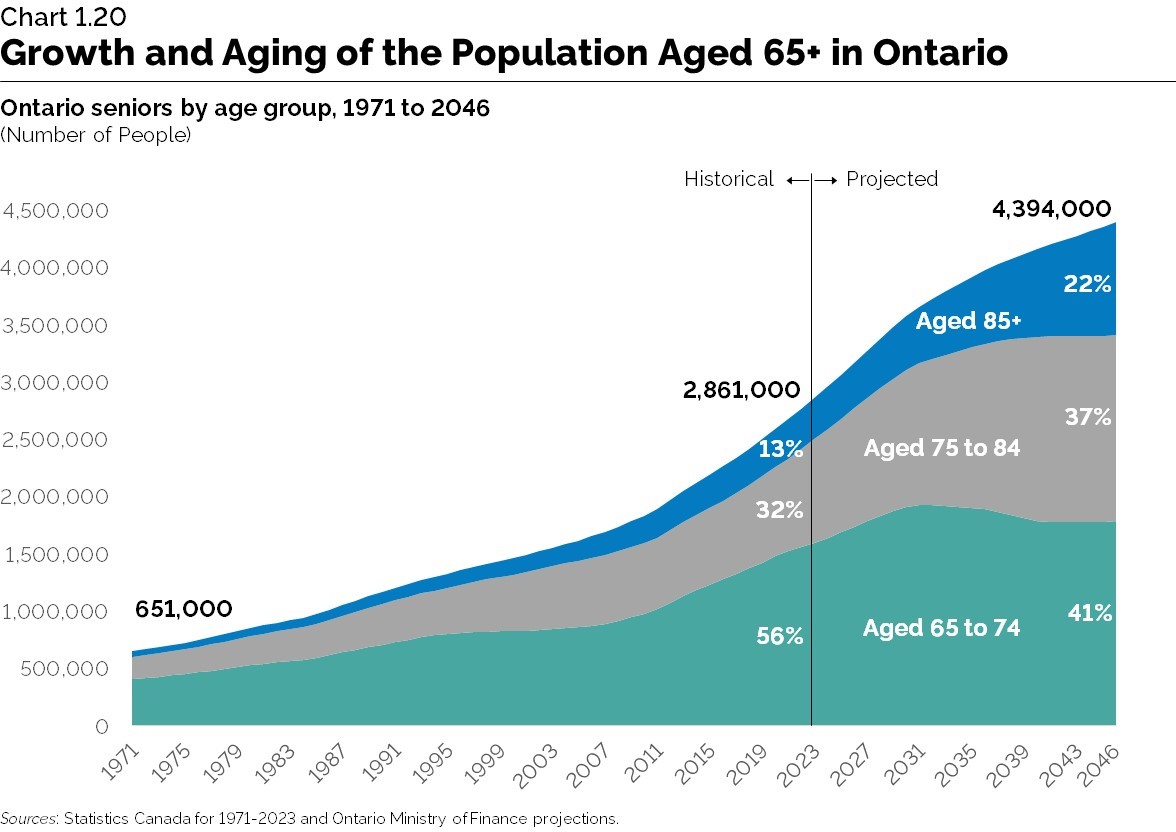
As a result, the 65+ age group will see a reversal of its proportion of younger versus older seniors. In 2023, the younger cohorts aged 65 to 74 (all baby boomers), represented the majority (56 per cent) of the senior population. By 2046, the 75+ age group will account for 59 per cent of all seniors, an increase largely driven by the passage of the large cohorts of baby boomers into the older senior age groups.
Alternative Scenarios
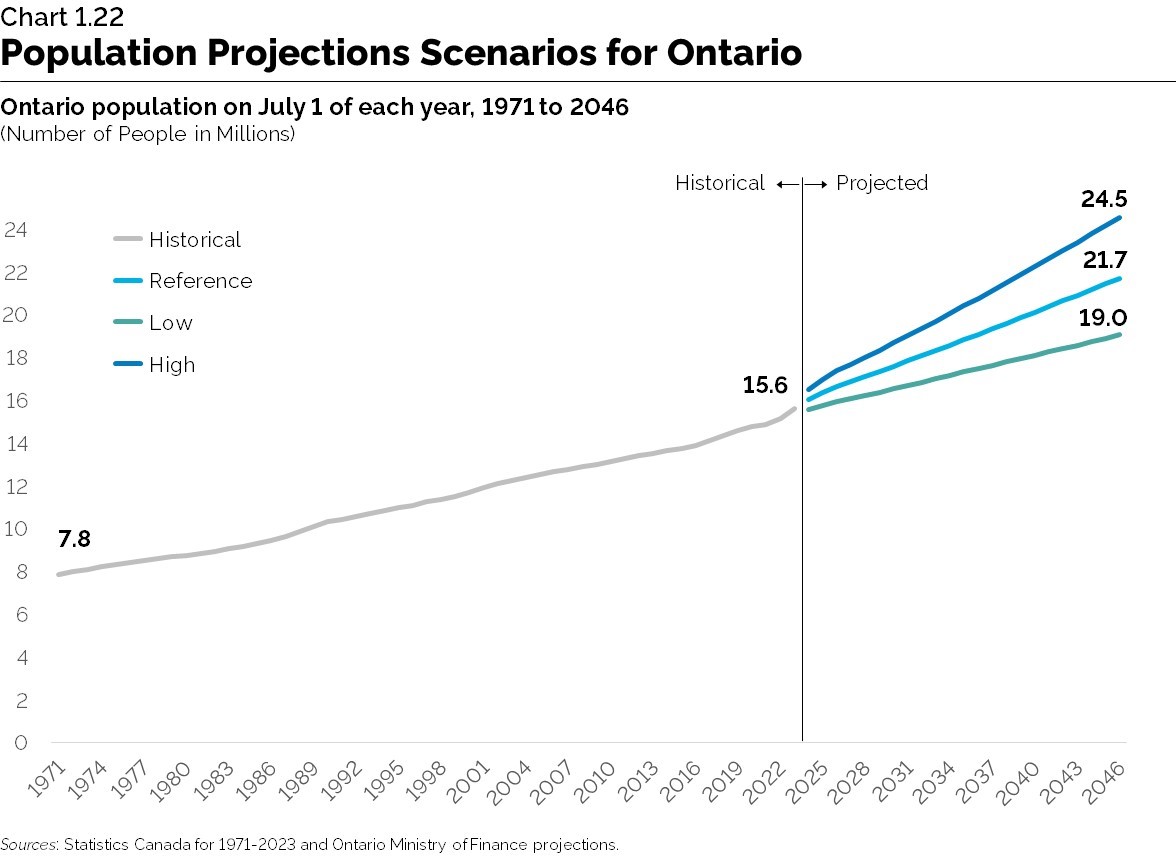
The Ontario Ministry of Finance projections provide three growth scenarios for the population of the province to 2046. The medium-growth, or reference scenario, presented in this chapter is considered most likely to occur if recent trends continue. The low- and high-growth scenarios provide a forecast range based on plausible changes in the components of growth.
Under all three scenarios, Ontario’s population is projected to experience growth over the 2023 to 2046 period. In the reference scenario, population is projected to grow 39 per cent, or almost 6.1 million, over the next 23 years from an estimated 15.6 million on July 1, 2023 to almost 21.7 million on July 1, 2046.
In the low-growth scenario, population increases 22 per cent, or 3.4 million, to reach over 19 million people by 2046. The age profile of the population is older in this scenario as a result of lower fertility and fewer international migrants.
In the high-growth scenario, population grows 57 per cent, or 8.9 million, to 24.5 million people by the end of the projection period. In this scenario, population aging takes place at a slower pace as a result of higher fertility and more international migrants.
| Low Scenario | Reference Scenario | High Scenario | |
|---|---|---|---|
| 2046 Population | 19,038,542 | 21,692,236 | 24,542,399 |
| Population Growth (2023 to 2046) | 3,430,173 | 6,083,867 | 8,934,030 |
| Population Growth Rate (total 2023 to 2046) | 22% | 39% | 57% |
| Population Growth Rate (average annual 2023 to 2046) | 0.87% | 1.44% | 1.99% |
| Natural Increase (total 2023 to 2046) | 33,491 | 983,583 | 2,069,045 |
| Natural Increase Rate (average annual 2023 to 2046) | 0.01% | 0.23% | 0.44% |
| Net Migration (total 2023 to 2046) | 3,674,205 | 5,116,015 | 6,618,421 |
| Net Migration Rate (average annual 2023 to 2046) | 0.93% | 1.22% | 1.47% |
| Share of 0 to 14 Age Group in 2046 | 13.8% | 15.4% | 16.8% |
| Share of 15 to 64 Age Group in 2046 | 64.5% | 64.4% | 64.0% |
| Share of 65+ Age Group in 2046 | 21.6% | 20.3% | 19.1% |
Source: Ontario Ministry of Finance projections.
Implications of Ontario’s Demographic Outlook
Ontario’s unique demographic outlook comes with many potential economic, fiscal and policy implications. They differ from implications arising from the outlook of most other jurisdictions around the world with slower-growing populations that are aging at a faster pace.
The rapid pace of overall population growth projected for the long term in Ontario will support continued demand for public services. See Chapter 3: Fiscal Trends and Projections.
The fact that Ontario’s future population growth is set to increasingly be fuelled by young international migrants is likely to require continued efforts to ensure newcomers are successful in the provincial labour force and in their communities. Since the recent rapid increase in the number of non-permanent residents living in Ontario is also projected to continue, new and targeted ways of supporting this growing transient population can ensure their success and enhance their contribution to the provincial economy. See Chapter 2: Economic Trends and Projections.
Continued faster population growth in metropolitan areas will likely mean continued high demand for infrastructure such as transit, highways, water, electricity, and schools. See Chapter 4: Delivering Infrastructure for Long-Term Growth.
While the proportion of seniors will increase at a slower pace than in the past, the large increase in the number of seniors will require continued investment, in particular in the health sector. See Chapter 3: Fiscal Trends and Projections.
The increasing share of seniors is expected to weigh on future labour supply, since older workers transitioning into retirement age have significantly lower participation rates compared to other working-age groups. As the share of these workers continues to grow, it is expected to put downward pressure on the overall labour force participation rate. See Chapter 2: Economic Trends and Projections.
Chart Descriptions
Chart 1.1: Recent Population Growth Rate of Selected Countries and Ontario
This bar chart shows the rate of population growth over the most recent 12 months reported for selected countries and Ontario. Among jurisdictions, Ontario was highest at 3.5 per cent, followed by Canada at 3.2 per cent, Australia at 2.4 per cent, Spain at 1.1 per cent, the United Kingdom at 0.9 per cent, the Netherlands at 0.8 per cent, The United States at 0.5 per cent, Denmark at 0.5 per cent, Portugal at 0.4 per cent, Germany at 0.4 per cent, France at 0.3 per cent, Sweden at 0.2 per cent, Italy at 0.0 per cent, South Korea at -0.2 per cent, Greece at -0.5 per cent, and Japan at -0.5 per cent.
Chart 1.2: Growth Rate of Ontario’s Population
This bar chart shows the growth rate of Ontario’s population from 1971 to 2046. Recently, the annual growth rate increased significantly, reaching 3.1 per cent in 2022–23. Over the projection period, the annual growth rate declines rapidly in the short term to return to a more normal pattern, reaching 1.4 per cent by 2026–27. Over the rest of the projection period, the annual growth rate declines slowly to just below 1.3 per cent by 2045–46.
Chart 1.3: Natural Increase and Net Migration in Ontario
This chart shows the annual level of natural increase and net migration in Ontario from 1971 to 2046. It shows that in recent years, net migration increased significantly, reaching 448,000 in 2022–23, while natural increase declined to 15,000. Over the projection period, net migration declines rapidly in the short term to return to a more normal pattern by 2026–27 at 186,000, with natural increase at 41,000. By the end of the projection period in 2045–46, net migration reaches 224,000, with natural increase at 47,000.
Chart 1.4: Net Interprovincial Migration to Ontario
This bar chart shows annual net interprovincial migration to Ontario from 1971 to 2023. It shows successive periods of net gains followed by successive periods of net losses. For the last period (2022–23), Ontario recorded a net loss of 42,000 people from the rest of Canada.
Chart 1.5: Immigration Rate of Selected Countries and Ontario
This bar chart shows annual number of new immigrants per 1,000 residents in 2022 in selected countries and Ontario. Among jurisdictions, Ontario was highest at 12.33 per 1,000 residents, followed by Denmark at 11.96, the Netherlands at 11.78, Portugal at 11.73, Canada at 11.35, Spain at 9.95, Sweden at 8.98, the United Kingdom and Germany both at 11.71, Australia at 6.41, Italy at 4.60, France at 4.40, Greece at 4.19, the United States at 3.15, South Korea at 1.19, and Japan at 0.85.
Chart 1.6: Immigration to Ontario
This bar chart shows annual immigration levels to Ontario from 1971 to 2046. In recent years, immigration to the province increased significantly, reaching 227,000 in 2021–22 and 199,000 in 2022–23. Over the projection period, annual immigration is projected to continue increasing to reach 257,000 by 2045–46.
Chart 1.7: Age Distribution of New Immigrants Compared to Total Population of Ontario
This chart shows the age distribution of both new immigrants to Ontario in 2022–23 and total population on July 1, 2023. Two-thirds (67 per cent) of new immigrants who settled in the province over 2022–23 were between the ages of 18 and 44. The median age of 2022–23 newcomers was 29 years, compared to 40 years for the resident population.
Chart 1.8: Non-Permanent Residents in Ontario
This bar chart shows the number of non-permanent residents living in Ontario on July 1 of each year from 1971 to 2046. In recent years, the number of non-permanent residents living in the province increased significantly, reaching 987,000 on July 1, 2023. Over the projection period, the number is projected to continue increasing in the short term to reach 1,538,000 by 2026. By 2026, the number is projected at 1,842,000.
Chart 1.9: Composition of the Non-Permanent Resident Population in Ontario
This pie chart shows the distribution of non-permanent residents by permit type in Ontario on July 1, 2023. Out of a total of 987,000, 91,000 or 9 per cent were asylum claimants, 32,000 or 3 per cent were other, 285,000 or 29 per cent were study permit holders, 160,000 or 16 per cent were holders of both work and study permits, and 420,000 or 43 per cent were work permit holders.
Chart 1.10: Non-Permanent Residents as a Proportion of Ontario’s Population by Age
This bar chart shows the share of non-permanent residents living in Ontario by age on July 1, 2023. Non-permanent residents accounted for over 5 per cent of the population at each age between 17 and 40, peaking at over 30 per cent at ages 21 to 24.
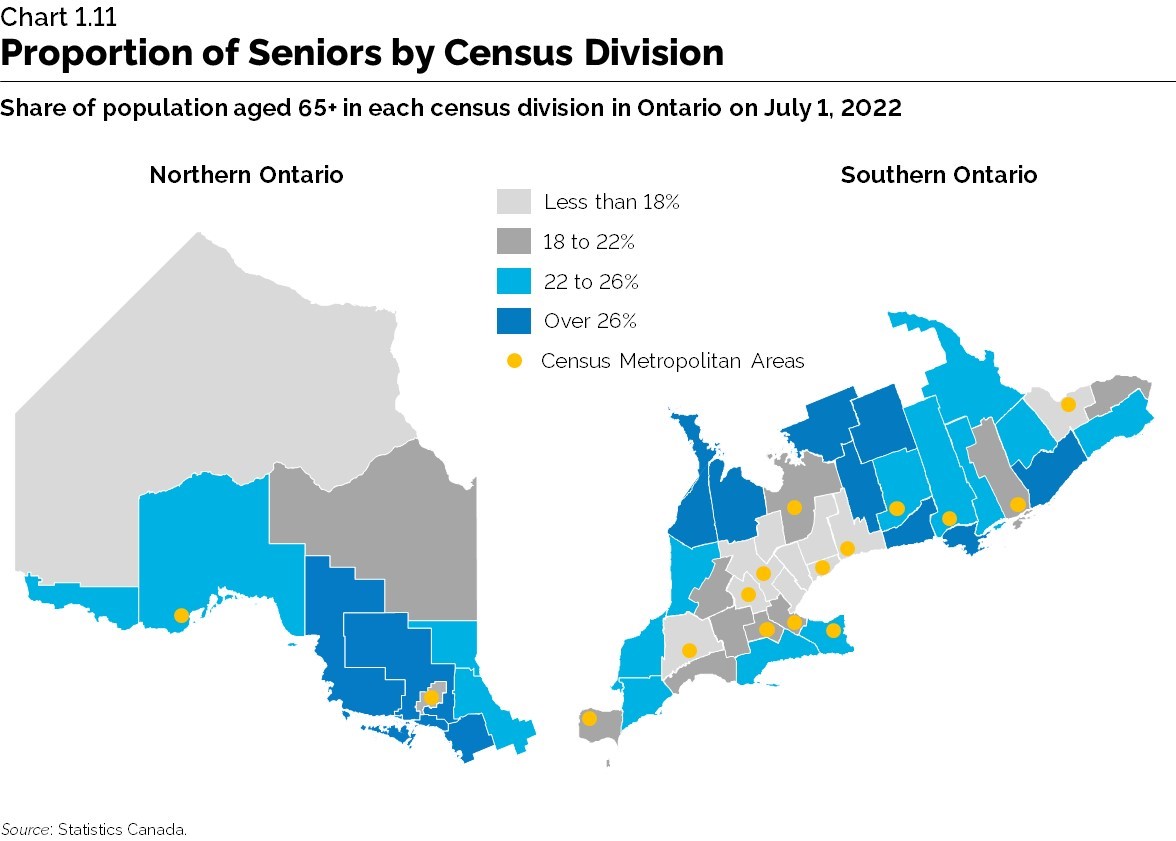
Chart 1.11: Proportion of Seniors by Census Division
This map shows the share of population aged 65+ in each census division in Ontario on July 1, 2022. Seniors aged 65+ made up less than 18 per cent of the population of the census divisions of Kenora, Middlesex, Waterloo, Wellington, Dufferin, Halton, Peel, York, Toronto, Durham and Ottawa. They made up 18 to 22 per cent in the census divisions of Cochrane, Greater Sudbury, Essex, Elgin, Perth, Oxford, Brant, Hamilton, Simcoe, Frontenac, and Prescott and Russell. In the census divisions of Rainy River, Thunder Bay, Timiskaming, Nipissing, Lambton, Chatham-Kent, Huron, Haldimand-Norfolk, Niagara, Peterborough, Hastings, Lennox and Addington, Renfrew, Larnak, and Stormont, Dundas and Glengarry, they made up between 22 and 26 per cent. Seniors aged 65+ made up over 26 per cent of the population of the census divisions of Algoma, Subdury, Manitoulin, Parry Sound, Bruce, Grey, Muskoka, Haliburton, Kawartha Lakes, Northumberland, Prince Edward, and Leeds and Grenville.
Chart 1.12: Natural Increase by Census Division
This map shows natural increase (birth minus deaths) in each census division in Ontario in 2021-22. The following census divisions had positive natural increase: Kenora, Bruce, Middlesex, Elgin, Oxford, Waterloo, Brant, Wellington, Hamilton, Halton, Dufferin, Peel, York, Toronto, Durham, Simcoe, Ottawa, and Prescott and Russell. The following census divisions had negative natural increase: Rainy River, Thunder Bay, Algoma, Sudbury, Manitoulin, Greater Sudbury, Cochrane, Timiskaming, Nipissing, Parry Sound, Essex, Chatham-Kent, Lambton, Huron, Grey, Haldimand-Norfolk, Niagara, Muskoka, Haliburton, Kawartha Lakes, Peterborough, Northumberland, Prince Edward, Hastings, Lennox and Addington, Frontenac, Renfrew, Lanark, Leeds and Grenville, and Stormont, Dundas and Glengarry.
Chart 1.13: Population Growth in the 15 Most Populous Metropolitan Areas in Canada and the United States
This bar chart shows the 2021-22 rate of population growth in the 15 most populous metropolitan areas in Canada and the United States. At the top was Dallas at 2.2 per cent, followed by Toronto at 2.1 per cent, Houston at 1.7 per cent, Phoenix at 1.5 per cent, Atlanta at 1.3 per cent, Montreal at 0.9 per cent, Miami and Riverside both at 0.5 per cent, Washington at 0.1 per cent, Boston at -0.1 per cent, Philadelphia at -0.2 per cent, Los Angeles, New York and Chicago all three at -0.8 per cent, and San Francisco at -0.9 per cent.
Chart 1.14: Regional Population Projections
This map shows the projected population of Ontario regions in 2023 and 2046. Northwestern Ontario’s population is projected to grow from 0.24 million in 2023 to 0.27 million in 2046. Over the same period, the population of Northeast Ontario is projected to grow from 0.59 to 0.68 million, the Southwest from 1.8 to 2.5 million, Central Ontario from 3.4 to 4.9 million, Eastern Ontario from 2.0 to 2.8 million, and the Greater Toronto Area from 7.5 to 10.5 million.
Chart 1.15: Fertility in Ontario
This bar chart shows the total fertility rate in Ontario annually from 1921 to 2046. It shows the baby boom period from 1946 to 1965. It also shows that the provincial fertility rate fell below the cohort replacement level of 2.1 children per woman in 1972. Since 2008, the total fertility rate in Ontario has been declining from 1.63 to 1.27 in 2022. Over the projection period, it is projected to rise slowly to reach 1.50 by 2026.
Chart 1.16: Life Expectancy in Ontario
This line chart show life expectancy at birth for males and females in Ontario from 1980 to 2046. For males, life expectancy went from 72.0 years in 1980 to 79.6 years in 2022 and is projected to reach 84.3 years by 2046. For females, life expectancy went from 78.9 years in 1986 to 84.1 years in 2022 and is projected to reach 87.6 years by 2046.
Chart 1.17: Age Pyramid of Ontario’s Population
This age pyramid shows the number of males and females in Ontario by single year of age in 2023 and in 2046. The baby boom peak is visible around age 60 in 2023, along with the large cohorts of non-permanent residents in their 20s. There will be more people in all age groups by 2046 compared to 2023. By 2046, the largest cohorts in Ontario will remain those in their 20s.
Chart 1.18: Age Distribution of Ontario’s Population
This area chart shows the age distribution of Ontario’s population from 1971 to 2046. The proportion of children aged 0 to 14 years went from 28.4 per cent in 1971 to 14.9 per cent in 2023 and is projected to reach 15.4 per cent by 2046. The proportion of core-age population aged 15 to 64 years went from 63.3 per cent in 1971 to 66.7 per cent in 2019 and is projected to reach 64.4 per cent by 2046. The proportion of seniors aged 65+ went from 8.3 per cent in 1971 to 18.3 per cent in 2023 and is projected to reach 20.3 per cent by 2046.
Chart 1.19: Projected Change in the Size of the Working-Age Population
This bar chart shows the change in the number of residents aged 15 to 64 from 2023 to 2046 in selected countries and Ontario. Among jurisdictions, Ontario is projected to see the most growth with an increase of 34 per cent, followed by Canada at 17 per cent, Australia at 14 per cent, Sweden at 8 per cent, the United States at 3 per cent and Denmark at 2 per cent. The United Kingdom is projected to see a small decline (0 per cent). The other countries listed will experience declining populations aged 15 to 64, including France at -5 per cent, the Netherlands at -6 per cent, Germany at -13 per cent, Portugal at -21 per cent, Greece at -22 per cent, Spain at -23 per cent, Japan at -23 per cent, Italy at -25 per cent, and South Korea at -29 per cent.
Chart 1.20: Growth and Aging of the Population Aged 65+ in Ontario
This bar chart shows the number and distribution of the population of seniors in Ontario from 1971 to 2046, by broad age groups. The total number of seniors went from 651,000 in 1971 to 2.9 million in 2023 and is projected to reach 4.4 million by 2046. The proportion of seniors in the group aged 65 to 74 years is projected to decline from 56 per cent to 41 per cent. The proportion of seniors in the group aged 75 to 84 years is projected to rise from 32 per cent to 37 per cent. The proportion of seniors in the group aged 85+ is projected to rise from 13 per cent to 22 per cent.
Chart 1.21: Proportion of Seniors in Selected Countries and Ontario
This bar chart shows the proportion of seniors in selected countries in 2022. Japan had the highest proportion at 29.9 per cent, followed by Italy at 24.1 per cent, Portugal at 22.9 per cent, Greece at 22.8 per cent, Germany at 22.4 per cent, France at 21.7 per cent, Denmark at 20.5 per cent, the Netherlands at 20.3 per cent, Spain at 20.3 per cent, Sweden at 20.2 per cent, the United Kingdom at 19.1 per cent, Canada at 18.8 per cent, Ontario at 18.3 per cent, South Korea at 17.5 per cent, the United States at 17.1 per cent, and Australia at 16.9 per cent.
Chart 1.22: Population Projections Scenarios for Ontario
This line chart shows the population projection scenarios for Ontario prepared by the Ministry of Finance. It shows that Ontario’s population grew from 7.8 million in 1971 to 15.6 million in 2023. At the end of the projection period in 2046, the provincial population would reach 24.5 million under the high-growth scenario, 21.7 million under the reference scenario, and 19.0 million under the low-growth scenario.
Footnotes
- footnote[1] Back to paragraph Ontario Ministry of Finance, “Ontario Population Projections, 2022-2046, (summer 2023),” https://www.ontario.ca/page/ontario-population-projections
- footnote[2] Back to paragraph Holders of study permits can work up to 20 hours per week off campus without a work permit.
- footnote[3] Back to paragraph The federal Minister of Immigration, Refugees and Citizenship indicated a goal to decrease the proportion of temporary residents in Canada from 6.2 per cent of total population to 5 per cent over the next three years.