Chapter 5: Harnessing Sector Strengths to Support Growth 2024
Introduction
Ontario has a diverse, advanced economy, which accounts for almost 40 per cent of Canada’s total GDP. This chapter highlights key sectors in Ontario that have exhibited relatively strong growth in GDP and strong integration in domestic supply chains, making them well positioned to contribute to long-term economic growth and help improve Ontario’s productivity performance. These sectors include manufacturing and industries along the automotive and electric vehicle (EV) supply chain, life sciences, information and communications technologies (ICT), financial services and agri-food.
The future of Ontario’s economy and its sectors will also rely heavily on innovation. The diversity of Ontario’s economy provides opportunities for businesses to further develop collaborative relationships within and across sectors to help grow the industries of the future. In addition, the adoption of innovation and technology, including emerging technologies, will help Ontario businesses accelerate the development and commercialization of ideas to enhance long-term productivity and growth.
Finally, it is crucial to have a reliable, clean electricity grid to help attract investments and ensure Ontario can meet projected electricity demand that supports the continued growth of these sectors while transitioning to the low carbon economy of the future.
Ontario’s Productivity Growth Challenge
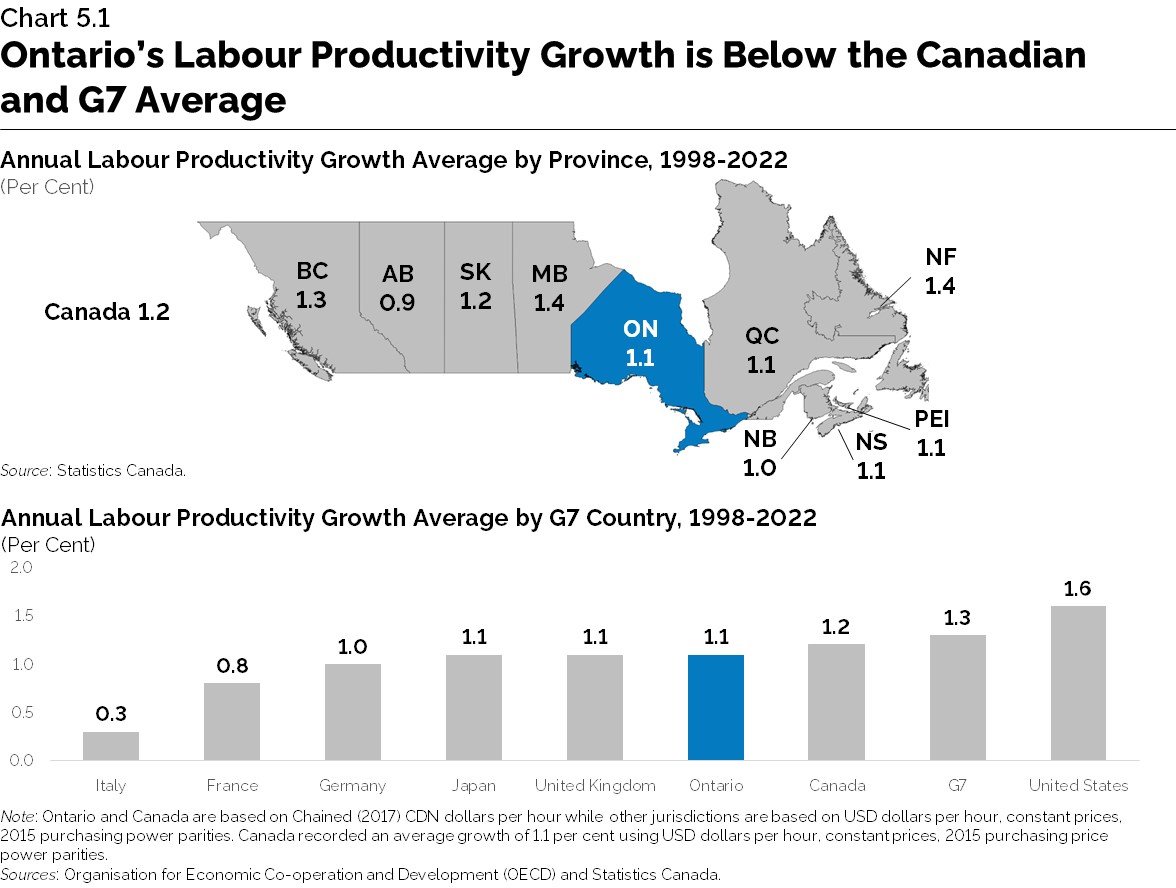
Ontario has the opportunity to capitalize on its sectoral strengths and attain higher levels of long-term economic growth by increasing its productivity, defined as real GDP per hour worked. Currently, the province faces a productivity growth challenge. Between 1998 and 2022, Ontario’s labour productivity experienced periods of cyclical variation with an annual average growth of 1.1 per cent, slightly below the national average. During this time, Ontario’s productivity growth lagged some other provinces and advanced economies. Labour productivity is expected to grow at 1.0 per cent annually over the projection period from 2024 to 2046. See Chapter 2: Economic Trends and Projections.
Labour productivity growth between sectors and their contribution to aggregate productivity growth varied between 1998 and 2022, with the highest average annual growth recorded in agriculture, forestry, fishing and hunting. Meanwhile, mining and oil and gas extraction recorded the lowest average annual percentage change. Sectoral variations can occur for many reasons, including the use of skilled labour and capital, differences in innovation capacity, as well as exposure to international competition and knowledge sharing.
Although not every sector has exhibited a productivity slowdown, Ontario’s overall low rate of productivity growth impacts the province’s potential economic output. Examining Ontario’s sectoral strengths and challenges can help identify potential opportunities to enhance long-term productivity and support prosperity for future generations.
Leveraging Ontario’s Sectors for Growth
Over the past two decades, Ontario’s economy has undergone a significant transformation, with productivity growth in various sectors shaped in part by shifts in employment and changing labour demands. Factors such as technological advancements and the rise in globalization have altered the nature of production processes and work in society, leading to a shift in employment growth from industries traditionally focused on manual routine tasks, such as labour-intensive manufacturing, to sectors with a prevalence of non-routine work, commonly seen in service and technology-dependent industries.
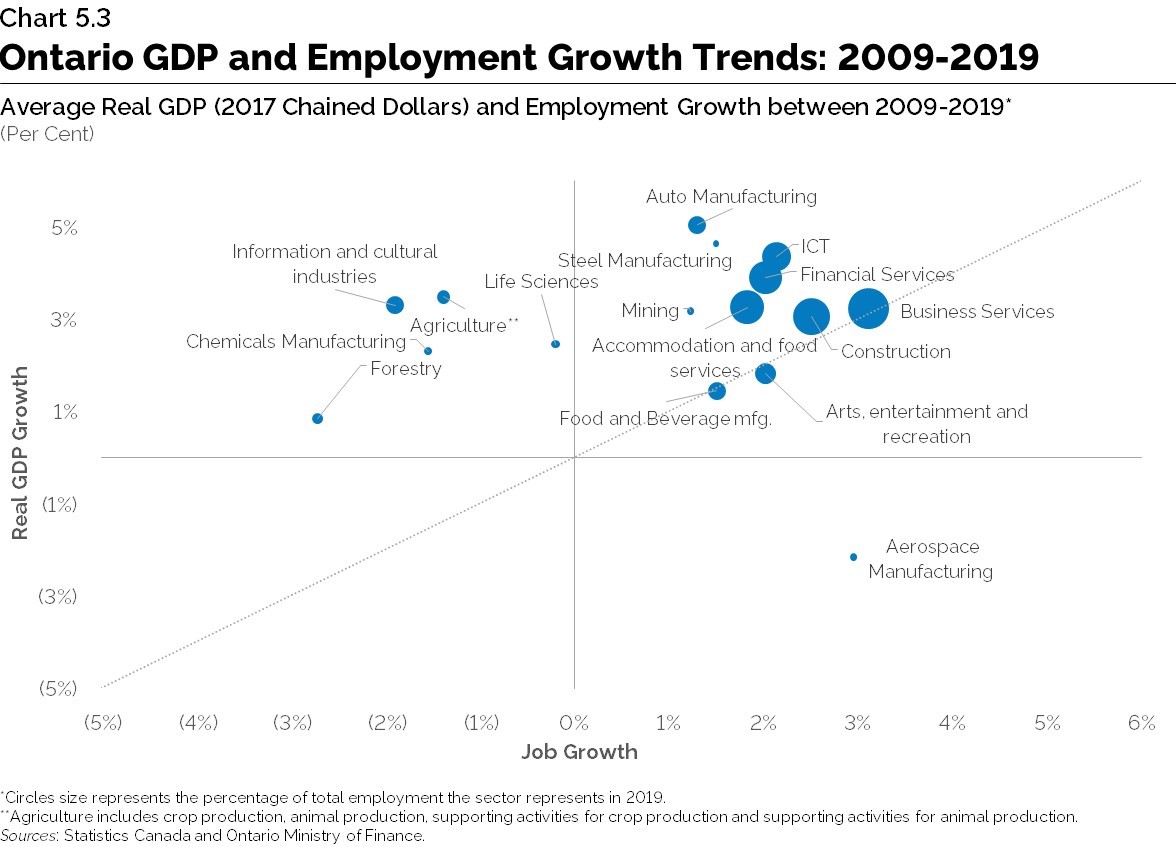
This transformation has led to the current structure of the provincial economy with many successful sectors that have a strong potential to contribute significantly to the growth in the goods and services that each member of the province’s workforce can produce, both directly and through supply chains. These industries have shown stronger growth in real GDP relative to employment growth over the past decade, and are shown above the diagonal line in Chart 5.3 below.
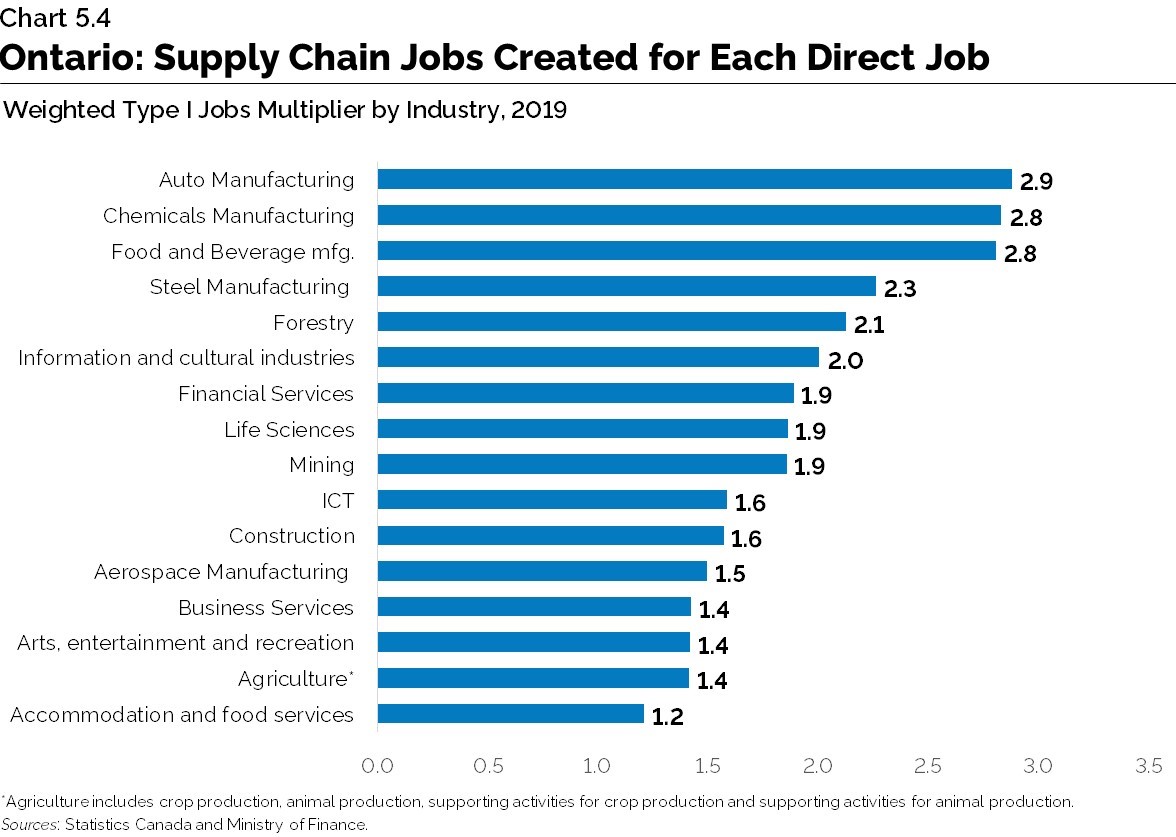
In addition, Chart 5.4 shows the linkages of selected industries to the rest of the domestic economy with a higher number signifying a stronger supply chain connection.
Ontario’s Existing and Emerging Sectoral Strengths
This section highlights some of the sectors of the economy that are well positioned to drive the future growth and prosperity of the province.
Transformation in Ontario’s Manufacturing Sector
Over the past 20 years, leading up to the COVID-19 pandemic, Ontario, along with many advanced industrialized countries, experienced a decline in the output and number of jobs in the manufacturing sector. This was driven by competitive pressures from the spread of global supply chains and from productivity gains by firms that outsourced their non-core functions abroad.
Manufacturing employment declined significantly from over 1.1 million jobs in 2004 to 766,400 jobs in 2010 before averaging 777,800 jobs between 2010 and 2019. Real GDP in the sector saw a similar decline before experiencing a modest rebound in growth until 2019, reflecting an increase in productivity. A similar phenomenon was observed in the U.S. and the European Union.
Despite these challenges, manufacturing in the province has shown recent progress with employment in the sector increasing by 75,400 between 2020 and 2023. Manufacturing also continues to be a source of good-paying jobs with the potential for spillovers into other sectors and opportunities to improve overall productivity.

Opportunities for Growth in the Electric Vehicle Supply Chain
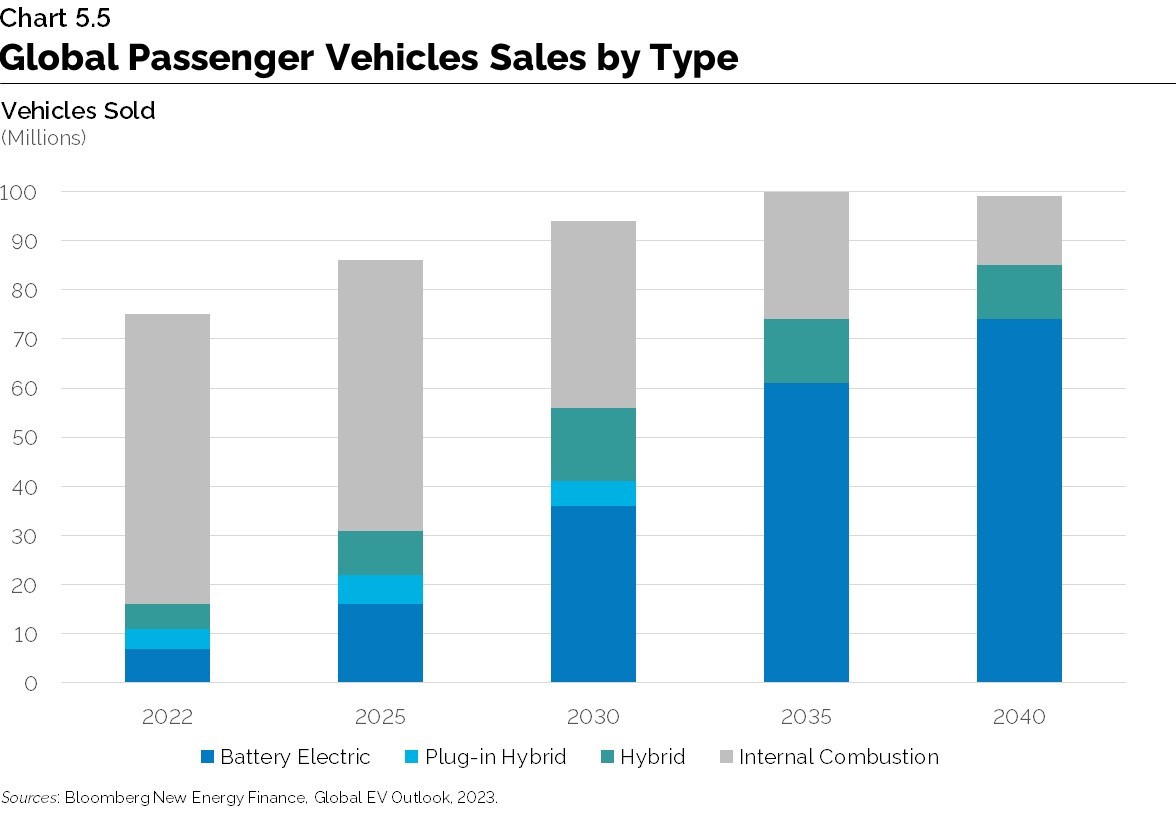
Within manufacturing, the automotive sector is undergoing a period of profound transformation. It is estimated that electric vehicles will reach 44 per cent of global passenger vehicle sales by 2030 and 75 per cent by 2040. Technological change is at the core of this transition, with battery prices falling by as much as 90 per cent in the last decade. Annual global lithium battery demand is also expected to grow rapidly, approaching 5.7 terawatt hours (TWh) annually by 2035.
EVs and batteries are now a central part of many countries’ industrial policy and competition to attract these investments is likely to increase in the coming years. In particular, the passage of the Inflation Reduction Act (IRA) by the United States in 2022 has had a significant impact on industrial policy.
However, the competitive advantage of Ontario’s automotive sector, the province’s critical mineral resources and the strategic financial support from the government have helped the province attract over $43 billion in investments from global automakers, parts suppliers, and manufacturers of electric vehicle batteries and battery materials over the past three years.Support for these investments is part of the Government of Ontario’s automotive plan, Driving Prosperity, which was launched in 2019 and includes goals to reposition the province’s vehicle and parts production for the cars of the future, and establish and support a battery supply chain ecosystem.
As the EV supply chain grows, there will also likely be gaps between supply and demand for critical mineral inputs such as lithium, nickel, graphite and copper.
The province’s supply of critical minerals and proximity to North American manufacturing hubs make the province a competitive location for mineral exploration and investment. To help leverage these opportunities the Ontario government released a Critical Minerals Strategy in 2022. The Strategy is a five-year roadmap to support better connections between the mines in the North with the manufacturing sector in the South; particularly, with Ontario-based EV and EV battery manufacturing.
Ontario’s steel industry is also becoming an important part of the province’s EV supply chain, in addition to supporting industries such as construction, metal product manufacturing and machinery manufacturing. The province represents half of the primary metal manufacturing employment in the country, with steel making up a significant share of the industry.
Strengths and Opportunities
- Increasing global demand for clean technologies.
- Rising geopolitical tensions increase the interest in strengthening supply chains with Ontario's closest trading partners.
- Increasing automation and the integration of advanced manufacturing technologies.
- Ontario is near major markets and has strong environmental, social and governance (ESG) practices that could support increasing demand for critical minerals to support the EV transition.
- Skilled manufacturing workforce recognized for production quality (e.g., nearly 40 J.D. Power Plant Quality Awards won by Ontario auto plants).
Potential Future Risks
- Persistence of weak business capital spending.
- Competition for investment driven by U.S. industrial policy initiatives (CHIPS and Science Act and IRA, 2022).
- Expected wave of retirements in the coming decade, which will increase pressure on the labour force and may exacerbate the skills shortage.
- Significant costs to achieve net-zero emissions in the manufacturing sector.
footnote 10 - Ontario’s mining sector will need to attract investment to increase production and address several mid-stream bottlenecks in processing and refinement.
Life Sciences
The province’s life sciences sector includes pharmaceutical production, production of medical devices and equipment, and research and development, as well as companies engaged in pharmaceutical and professional equipment wholesaling.
Ontario has a long history of life sciences discoveries and innovations, including blood-forming stem cells; cancer stem cells in leukemia; neuroleptic receptors; early-onset Alzheimer’s genes; external cardiac pacemakers; identification of the gene for cystic fibrosis; and insulin.
While these discoveries significantly improve the quality of life, the sector also generates important economic benefits for Ontario. The province’s life sciences sector is the largest in Canada with approximately 2,000 firms and more than 72,800 workers in 2022.
The industry also has strong supply chain linkages with the rest of the economy. For each direct manufacturing job created in life sciences, nearly two jobs are created across the Ontario economy. Furthermore, in pharmaceutical production, over 40 per cent of all purchases of intermediate inputs are sourced from other industries in the Ontario economy.
Within the last decade, the province has become a hub for clinical trial activity and employment in pharmaceutical production and in the production of medical devices and equipment has increased by nearly 50 per cent in the past two decades. In 2022, the sector exported $8 billion in goods, representing about 57 per cent of the total for Canadian life sciences.
Key factors for the continued long-term growth of the life sciences industry include a pool of experienced talent, a collaborative ecosystem,
The sector also stands to benefit from stronger engagement with the venture capital (VC) community, especially in the later stages of the pre-commercialization process that can help boost manufacturing readiness of life sciences companies.
In 2021, Ontario attracted more than half of all venture capital investments in Canada, including $847 million in life sciences.
To further develop the key growth factors noted above, the Ontario government released the Taking Life Sciences to the Next Level strategy in 2022 to help establish Ontario as a global biomanufacturing and life sciences hub. The Strategy aims to boost the capacity of the province’s life science companies and start-ups by strengthening talent, advancing research and improving access to the venture capital ecosystem. This would help life science companies lead in the development, commercialization, and early adoption of innovative health products and services.
Strengths and Opportunities
- A thriving life sciences sector has spillover benefits to other industries, given its strong linkages to rest of the economy.
- Transformative technologies, including genomics, synthetic biology, AI and data science, are presenting new growth opportunities for Ontario to help fuel innovation.
- Other niche strengths and opportunities include regenerative medicine, biochips, mRNA, and applications in nuclear medicine, oncology, and rare diseases.
Potential Future Risks
- Insufficient access to capital in early stages, with commercialization most at risk.
- Specialized talent gaps at executive and management levels may limit scale-up and commercialization prospects for the sector.
- Lack of wet-lab space is a risk to retaining talent, intellectual property (IP) and longer-term growth in life sciences.
Information and Communication Technologies
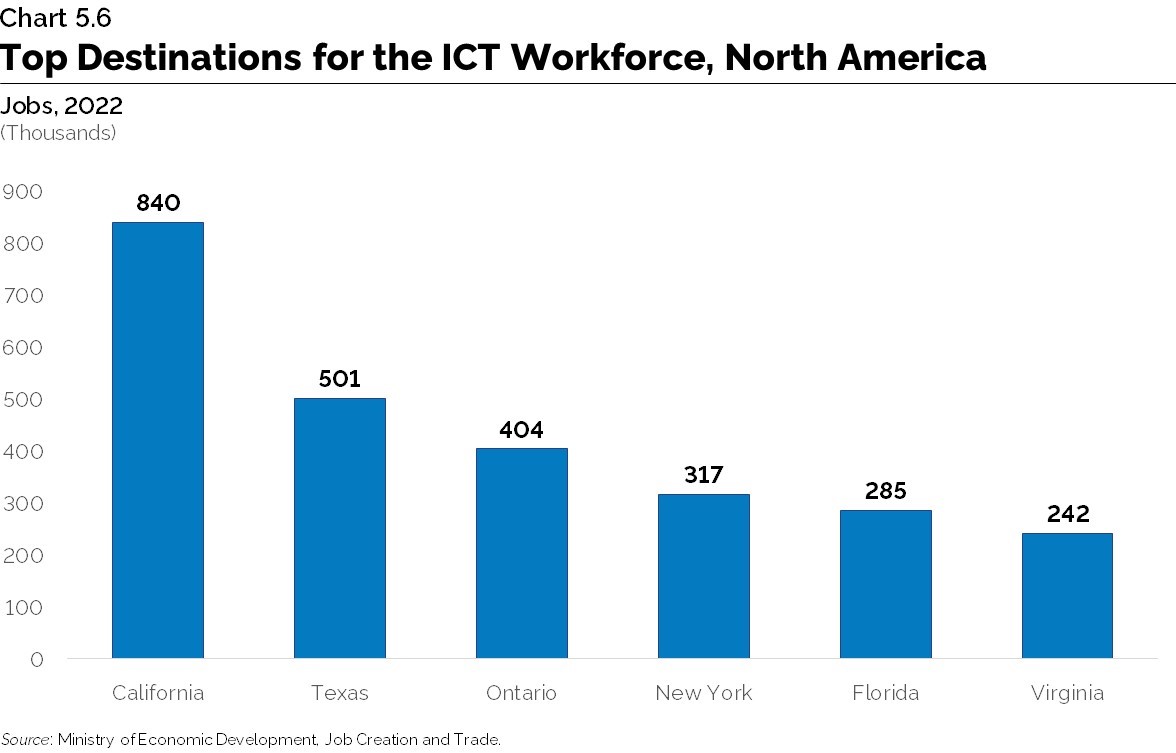
Ontario is one of Canada’s leading technology regions and is home to a robust and diversified digital economy. With over 400,000 Information and Communication Technology (ICT) workers employed in Ontario, the province is one of the largest information technology clusters in North America.
The sector’s domestic accomplishments include the BlackBerry, the world’s first Geographical Information System (GIS) software, the invention of the smart thermostat, IMAX film technology, ground-breaking two-way wireless technology and breakthroughs in 3D animation. Made-in-Ontario technologies have also been on board 80 per cent of the commercial communications satellites ever launched.
Ontario is also home to some of the most cutting-edge cloud computing and big data analysis in the world, with established players such as IBM, OpenText, Oracle and SAP conducting business-critical research and development across the province. Within the province, Waterloo has a strong quantum technologies hub
Telecommunications services in the province continue to evolve with new technology and changing consumer demands. The pandemic rapidly accelerated this shift as broadband internet and mobile services have become essential to participate in the economy and in society. The sector has been rapidly shifting toward 5G technology and the Internet of Things (IoT), with a focus on developing applications for this rapid increase in internet speed for industry and home use.
Artificial intelligence (AI) is also changing the landscape for businesses and the economy. The recent breakthroughs that have enabled the rise of generative AI were pioneered in Ontario more than 30 years ago and today the industry is growing rapidly because of significant levels of investment in recent years.
Through the Critical Technologies Initiative, the Ontario government is supporting programs that accelerate the use of critical technologies such as 5G and AI to improve productivity and support innovation and long-term economic growth. The initiative also supports the development, commercialization, and adoption of technology by Ontario companies.
Strengths and Opportunities
- Innovation and ICT adoption will boost demand for highly skilled talent.
- Local postsecondary institutions produce highly skilled and dependable graduates for Ontario businesses.
- Ontario is North America’s third largest market for tech talent, just behind New York and San Francisco Bay Area.
Potential Future Risks
- The rapid growth of the industry globally creates recruitment and retention challenges for tech employers.
- Long-term skills challenges include cybersecurity, advanced networks, quantum and semiconductor subsectors.
- Insufficient domestic startup funding for new companies due to fewer private equity resources which can lead to and limited ability to retain intellectual property in the province.
- Increased cybersecurity threats from advances in ICT, leading to higher costs in the sector.
Financial Services
The financial services sector plays an important role in supporting economic growth and productivity in Ontario by facilitating investments and supporting the financial needs of consumers and large and small businesses.
The financial services sector
Ontario’s financial services companies are concentrated in downtown Toronto, close to IT, professional and other services. This concentration provides a strategic advantage that gives businesses an edge in global competition, as they are easily connected to leading financial institutions, innovative ICT technologies and talent. The province supplies a pool of more than 67,000 business graduates a year and has the largest Chartered Financial Analyst society in the world.
A strong financial services sector has the capacity to contribute to productivity growth by raising its own output per labour and capital input. According to the OECD, average productivity growth in Canada’s financial services sector has been the fastest relative to other non-agriculture business sectors since 2008.
Equally important, however, is the capacity of a strong financial services sector to help improve productivity in the rest of the economy as a by-product of the services it provides.
One way the financial services sector can further contribute to productivity growth is by increasing innovation and competition within the sector. For example, improved access to FinTech solutions may facilitate the ability of Ontario firms to access the capital needed to invest. The introduction of an open banking environment in Canada has the potential to enable further development and use of FinTech, which may increase innovation and competition by allowing smaller financial services firms to provide increased access to capital.
Similarly, Ontario’s strengths in other emerging technologies
The Ontario government continues to support the financial services sector facilitating further access to capital to further innovation and improve productivity. The 2023 Ontario Economic Outlook and Fiscal Review and the 2024 Ontario Budget put forward several initiatives designed to modernize Ontario’s capital markets in support of these goals. These include working with the Ontario Securities Commission (OSC) to facilitate greater early‐stage financing of Ontario startups and medium-sized companies. In addition, the government is also working with the OSC to enhance capital formation through investor access to investment opportunities in capital‐intensive assets.
Strengths and Opportunities
- Opportunities for innovation and productivity improvements to increase production and reduce the reliance on labour.
- Growing production and expanded access to markets through trade agreements have the potential to increase Ontario’s exports for certain food and beverage products.
- A diversified and resilient sector with a reputation for quality, sustainability and food safety.
Potential Future Risks
- Commodity price shocks, changing market conditions and geopolitically induced supply-chain disruptions.
- Labour shortages and an aging labour force could hold back growth.
- Aging infrastructure and lower levels of capital and R&D investment relative to competitors.
- Potential use of non-tariff trade barriers by Ontario’s trading partners to limit access to markets.
Agri-Food
The Ontario agri-food sector includes primary agriculture; food manufacturing; parts of wholesale and retail trade; and food services and drinking places. Between 2012 and 2023, the sector employed an average of 803,000 workers, representing 11.2 per cent of jobs in Ontario over this period. The sector also contributed an average of 6.3 per cent to Ontario’s real GDP from 2012 to 2022.
Since 2000, total farm product output, farm cash receipts and global exports have increased due to productivity improvements in the sector. In the medium term, GDP in the broader sector is projected to continue growing faster than employment, at an average annual rate of 1.4 per cent through the early 2030s.
As Ontario’s population expands, the demand for agri-food products is expected to grow as well and local food production will need to rise to support the diverse needs and preferences of the province’s growing population. At the same time, as efficiencies in production accrue, the opportunity to expand exports will increase as well, contributing to overall growth in the economy.
The agri-food sector has shown robust output and productivity growth, but challenges remain, including volatile input costs, labour shortages, the need to increase farmland yields due to constrained farmland availability, and climate/weather hazards. In addition, the sector is experiencing shifts in consumer and global market expectations such as verifiable, sustainable, and ethical production practices.
Continued automation and the participation of international workers will help mitigate the impact of an aging and declining workforce at the farm. International agri-food workers play an essential role in maintaining a strong provincial food system. The use of advanced technologies such as new sensors, robotics and artificial intelligence will enable farm operators to continue to automate tasks traditionally reliant on human decision making to increase resiliency and farm efficiency.
Improving capital investment in the sector also continues to be part of the strategy for growth and integrating advanced technological solutions across the agri-food value chain will support streamlined operations, reduce input costs and enhance output.
The strategic long-term growth prospects for the sector are supported by government policies such as the Grow Ontario agri-food strategy, developed in collaboration with farmers, food sector leaders, businesses, and Indigenous representatives.
The strategy aims to support research and to encourage innovation, sustainability, and profitability in agri-food industries, as well as increasing the commercialization and adoption of innovative technologies. The strategy also focuses on attracting and growing Ontario’s academic and technical expertise, including robotics, automation, and genomics.
Strengths and Opportunities
- Opportunities for innovation and productivity improvements to increase production and reduce the reliance on labour.
- Growing production and expanded access to markets through trade agreements have the potential to increase Ontario’s exports for certain food and beverage products.
- A diversified and resilient sector.
Potential Future Risks
- Commodity price shocks, changing market conditions and geopolitically induced supply-chain disruptions.
- Labour shortages and an aging labour force could hold back growth.
- Aging infrastructure and lower levels of capital and R&D investment relative to competitors.
- Limited resiliency to weather patterns, declining farmland availability and constrained expansion of farmland.
- Potential use of non-tariff trade barriers to limit access to markets by Ontario’s trading partners.
Driving Growth in Sectors Through Innovation
Over the longer term, the sustained growth of Ontario’s sectoral strengths will rely heavily on innovation and the development, commercialization and adoption of technology. Fostering linkages in the innovation ecosystem that support the diffusion of new knowledge and technologies across the economy, as well as emphasizing the importance of new innovations, will play a key role in increasing productivity and advancing long-term economic growth.
Ontario’s Innovation Performance in R&D and Intellectual Property
There are several key metrics to measure the level of innovation in a jurisdiction, including business expenditures on R&D and intellectual property products (IPP).
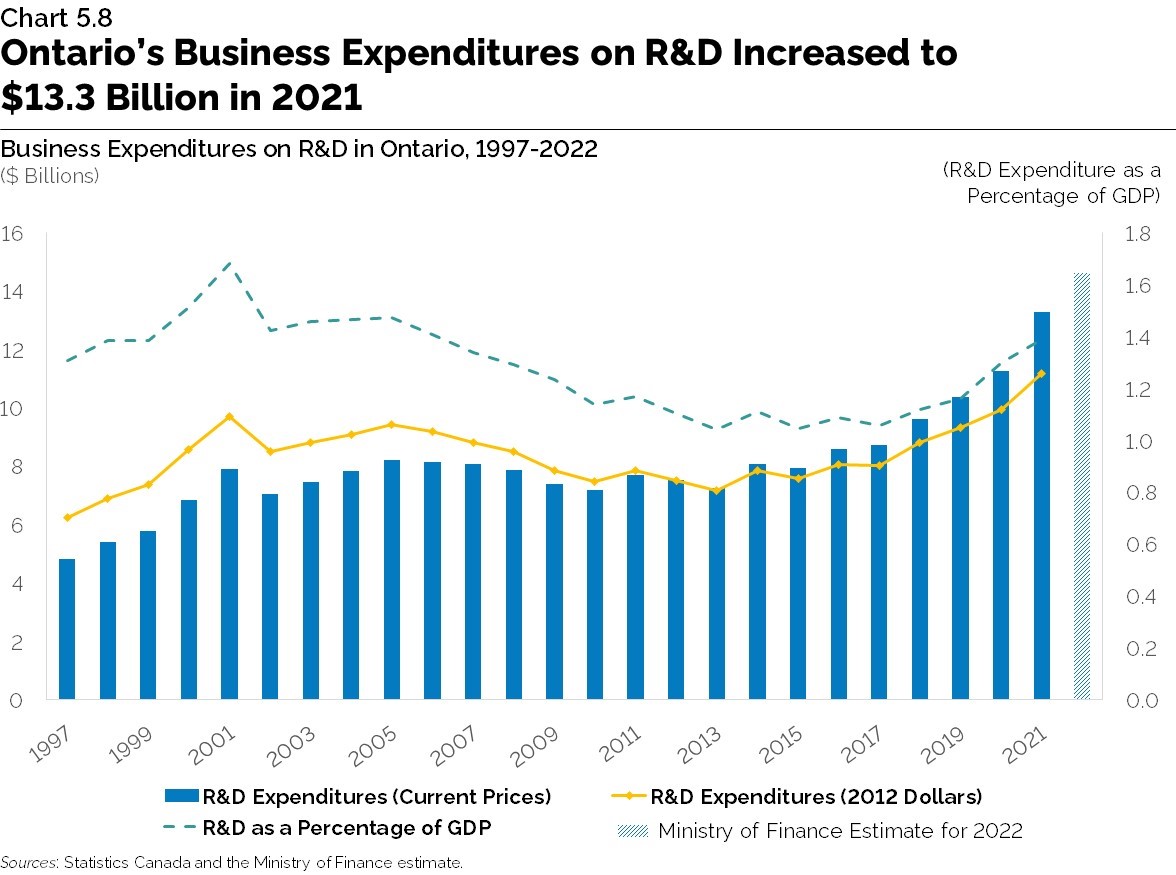
As shown in Chart 5.8, Ontario’s business R&D expenditure as a percentage of GDP, also known as R&D intensity, has demonstrated an upward trend over the last decade. Business R&D is typically concentrated among a small number of large companies. In 2022-23, Ontario was home to 46 of the top 100 Canadian R&D spenders, which accounted for $9.2 billion of total R&D spending nation wide.
In addition to R&D investments, IPPs (such as copyrights, trademarks, trade secrets and industrial design) are becoming an increasingly important contributor to long-term economic growth. Forward-looking firms recognize the role of IPPs and are able to gain a competitive advantage from these assets, while contributing to overall knowledge creation rather solely focusing on lowering costs in production supply chains.
Despite the importance of IPPs, Ontario and Canada continue to face challenges in producing innovative outputs, such as IPPs, and scaling up firms.
To harness the full value of IPPs, Ontario’s intellectual property agency, Intellectual Property Ontario (IPON), focuses on educating and supporting innovators throughout their IP journey to maximize IP value, enhance research outcomes and enable them to compete globally. Ontario also offers R&D tax credit programs to encourage business expenditures on scientific research and experimental development and continues to make key investments in research and research projects at universities, colleges, research hospitals and research institutes.
Fostering Ontario’s Innovation Ecosystem for Long-Term Economic Growth
Ontario is endowed with diverse advantages, including a highly skilled labour force, locational advantage to North American markets, and the number of high-value economic actors such as businesses, investors and academic institutions. Focusing on the diversity and collaboration of actors will help drive valuable innovation as well as stimulate investment and business activity.
There are several benefits that stem from promoting robust networks, such as spillover effects through knowledge transfers and the reinforcement of innovative clusters. Firms also reap additional productive advantages through mutual proximity, integration of supply chains, and specialization, which benefit sectors and regional economies.
To create and support these linkages in Ontario, the government supports industry collaborators such as the province’s Regional Innovation Centres (RICs) and the Ontario Centre of Innovation (OCI). These organizations help connect industry, academic, and government partners to drive investments in collaborative R&D, technology development and commercialization opportunities.
Adopting Artificial Intelligence to Help Transform Ontario’s Sectors and Increase Productivity
The adoption of emerging technologies has accelerated across sectors. Ongoing uptake of new technologies will help support the diffusion of technology across key sectors, reduce barriers to innovation adoption, and build capacity in domestic companies. One example of an emerging technology is AI, which can have potentially transformative impacts on sectors. AI has the potential to significantly reduce firm costs, drive innovation performance through higher levels of R&D, and address labour shortages.
| Select Sector | Examples of AI Applications in the Sector |
|---|---|
| Manufacturing |
|
| Agriculture |
|
| Financial Services |
|
| Life Sciences |
|
| Construction |
|
Canada is a leading source of AI talent, with the growth of AI talent outpacing several G7 countries and ranks high globally in venture capital investments per capita. Despite these advantages, Canadian firms face challenges in AI adoption, including firm size, financial costs and aggressive competition.
As previously noted, Ontario’s Critical Technologies Initiative supports the development, adoption and commercialization of critical technologies, including AI, to encourage further innovation across the province. This includes support for the Vector Institute for Artificial Intelligence to help businesses increase their competitiveness and accelerate the safe and responsible adoption of ethical AI. Building Ontario’s innovation capacity can help cultivate a strong entrepreneurial culture, encourage innovation and investment, and improve productivity, which has a significant advantage in today’s ever-changing global economy.

Leveraging Ontario’s Clean Energy Advantage to Support Economic Growth
Planning for Energy Transition and Future Energy Needs
Ontario’s clean electricity grid continues to be a competitive advantage in attracting investments and jobs to the province. The provincial government is continuing to support clean energy, which is essential for Ontario’s competitiveness and transition to a cleaner economy.
Electricity Supply
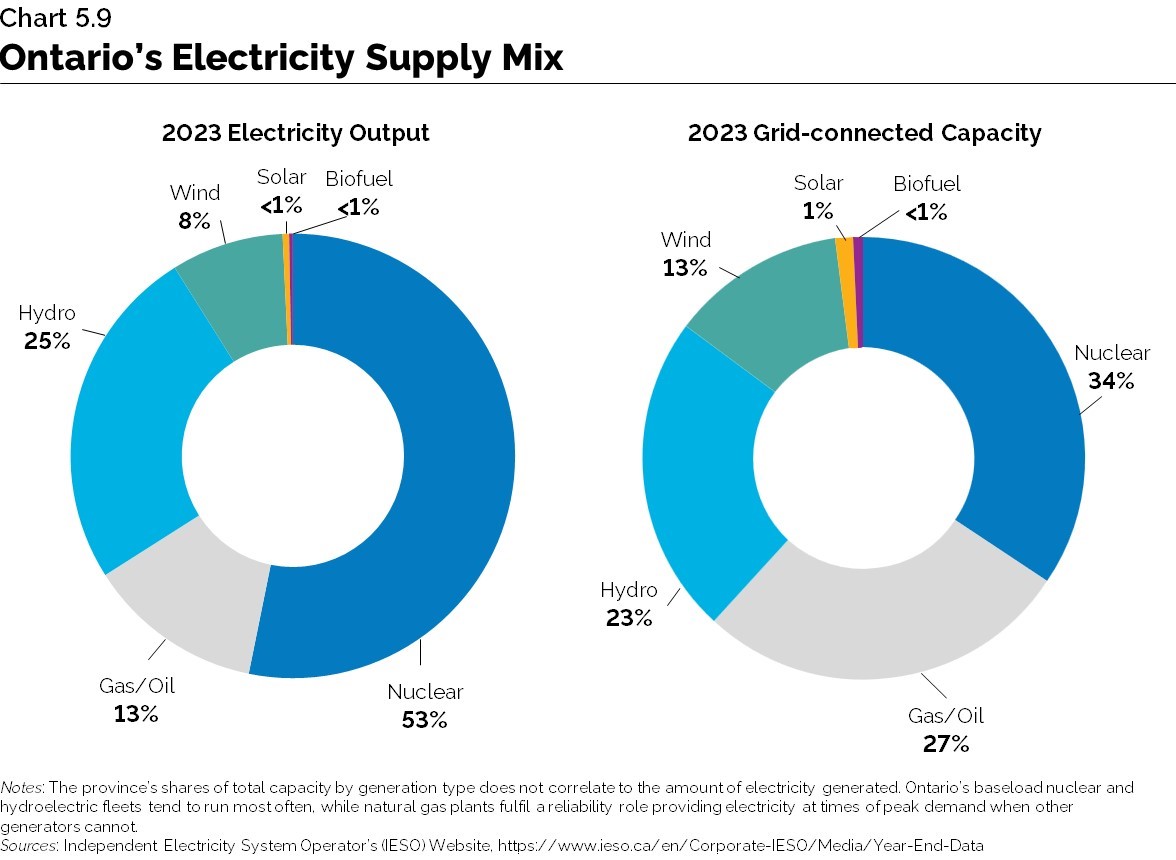
Ontario has a diverse electricity supply mix, with nuclear generation providing a large portion of its capacity and energy needs (see Chart 5.9). Ontario’s electricity system benefits from diverse resources, including hydroelectric, nuclear, natural gas, solar, wind and bioenergy, with each having specific operating characteristics, supporting ongoing reliability, as no single type of resource can meet all of the system’s needs at all times. Ontario’s clean electricity grid, which was about 87 per cent emissions-free in 2023, provides Ontario a global competitive advantage.
Electricity Demand
As electricity generation resources and transmission can take five to fifteen years to develop, early planning is increasingly critical as electricity demand growth is forecasted to increase. Released in March 2024, the Independent Electricity System Operator’s (IESO) 2024 Annual Planning Outlook (APO), provides a long-term view of Ontario’s electricity system, including forecasting system needs and exploring the province’s ability to meet them. The government also released its report, Powering Ontario’s Growth: Ontario’s Plan for a Clean Energy Future in July 2023, which includes plans for new zero‐emissions electricity generation, storage and transmission lines. During the transition, natural gas‐fired generation continues to provide the province with the capacity to meet electricity demand and maintain system reliability.
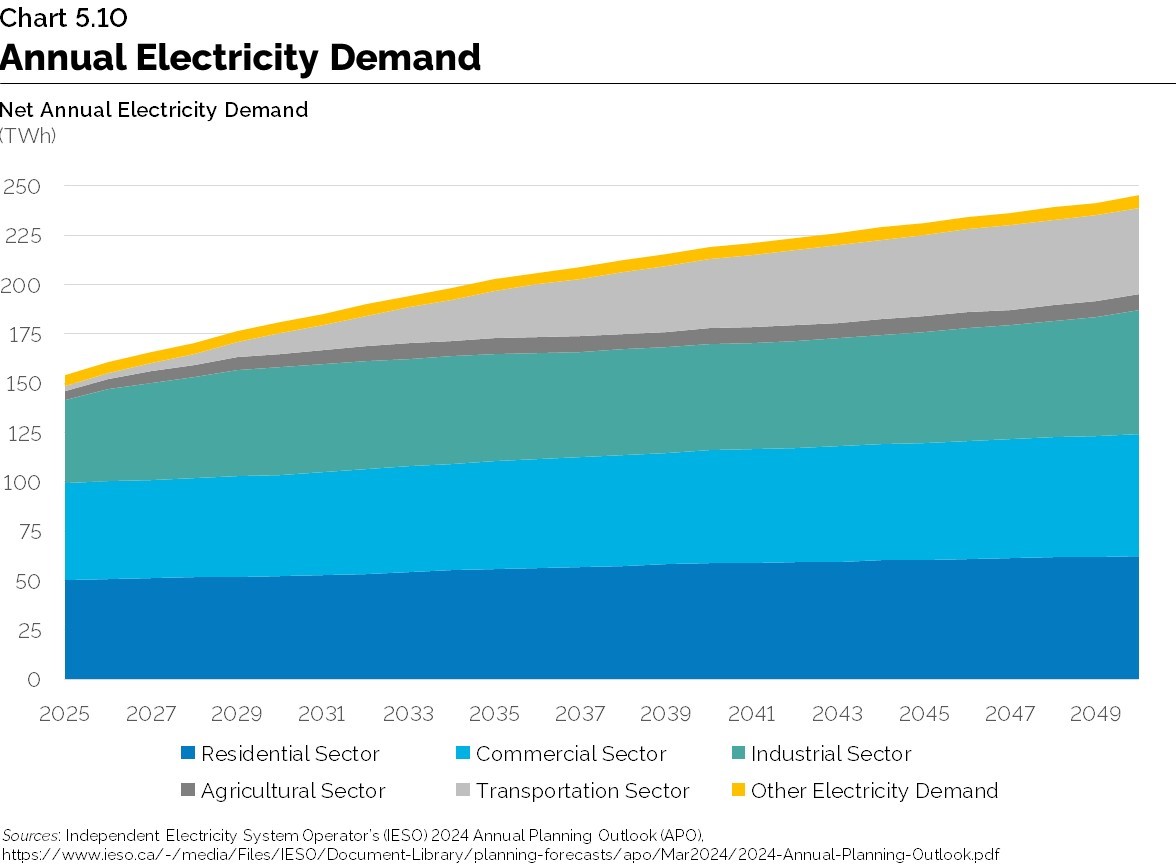
The IESO’s APO forecast shows electricity demand increasing by two per cent a year, on average, over the coming decades, from 154 terawatt hours (TWh) in 2025 to 245 TWh by 2050.
The forecasted increased demand is driven primarily by projected economic and population growth,
The IESO recognizes that the forecasting of electricity demand is subject to various dependencies and uncertainties, which increase with the length of the outlook period. This includes economic and demographic growth, technology, energy prices, fuel choices, conservation and demand management efforts, policies, and incentives at various levels of government, and consumer preference trends, among others.
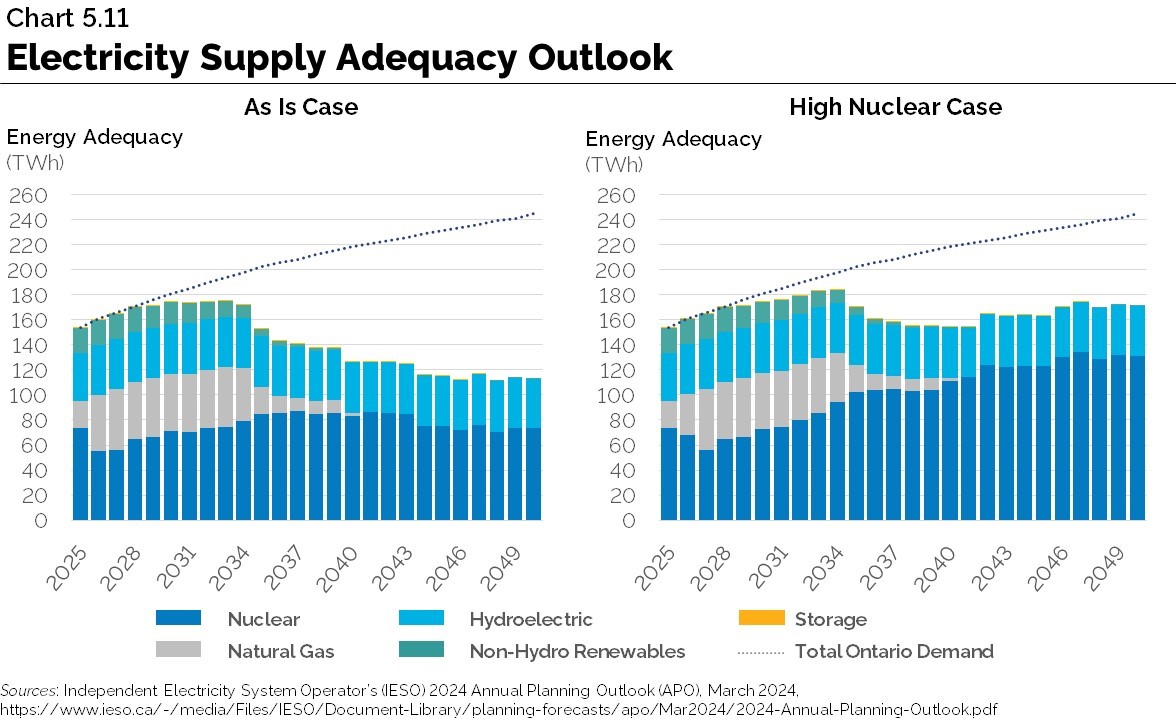
The IESO’s APO also reports that an energy gap is expected to emerge in 2029, consistent with previous outlooks. While the energy gap outlook diminishes in the long term with the return to service of refurbished nuclear units, an energy shortfall continues to be driven by increases in demand.
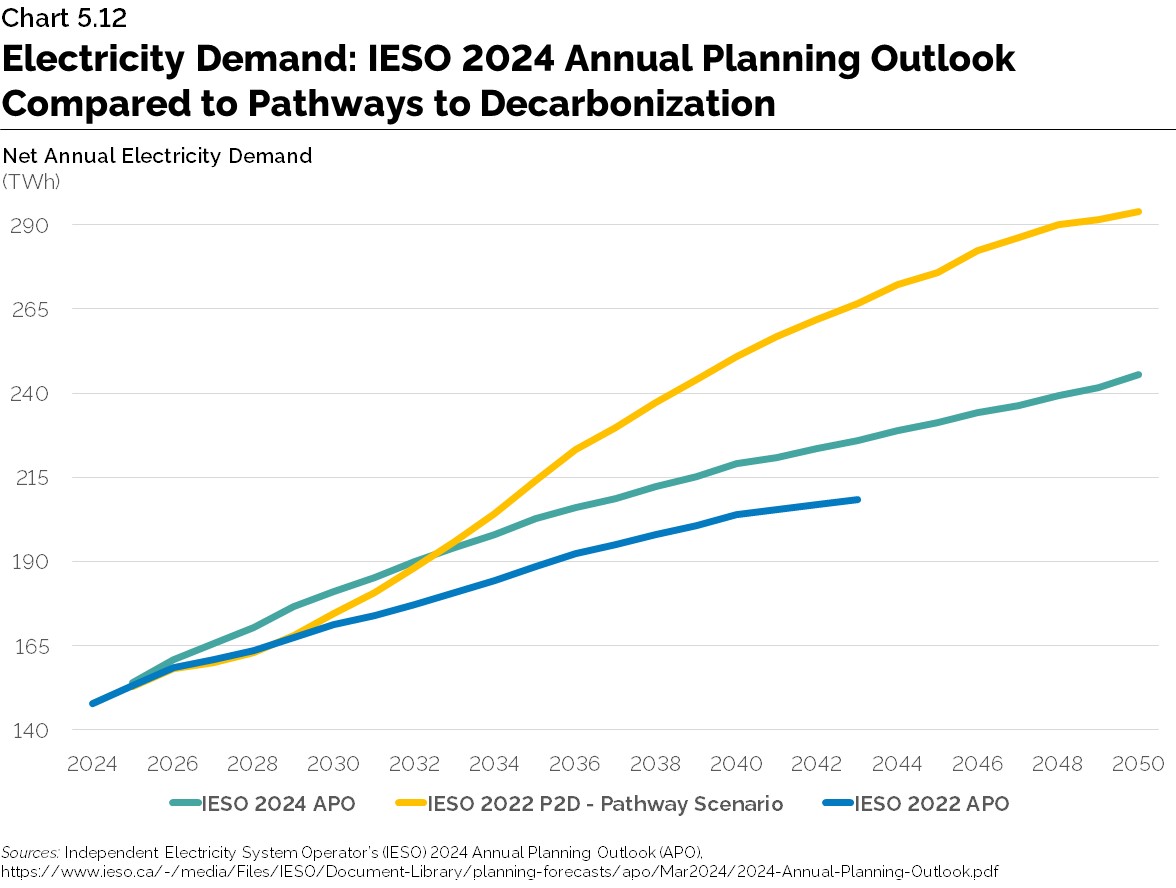
The IESO also explored a theoretical, aggressive decarbonization scenario in its Pathways to Decarbonization (P2D) report, released in December 2022. Compared to the APO forecast, which projects demand increasing by 60 per cent by 2050, the P2D electricity demand in the aggressive decarbonization scenario is higher and could more than double by 2050, as shown in Chart 5.12. This shows that Ontario would be required to more than double its electricity generating capacity by 2050, from 42,000 megawatts (MW) today to 88,000 EV.
Meeting Projected Electricity Demand
The government continues with electricity infrastructure initiatives to help ensure the province is able to meet its long-term energy needs. In October 2022, the Minister of Energy directed the IESO to acquire 4,000 EV of new electricity generation and storage resources, including up to 1,500 EV of natural gas generation through multiple competitive procurements, which would help cover the electricity needs of this decade and support a growing population and economy while nuclear reactors are taken temporarily offline for refurbishment
The IESO concluded two of these procurements to acquire approximately 880 EV of new electricity storage capacity and 586 EV of new capacity from expansions and upgrades at existing natural gas generation facilities. In addition, to help address longer-term requirements, Ontario is working towards expanding storage and non-emitting electricity generation capacity, including leveraging the Ontario nuclear sector, a world leader in experience and expertise. Examples of efforts to help address the forecasted shortfall and contribute to the transition to a decarbonized electricity system include:
- Procuring 2,500 MW of standalone clean energy storage. This is in addition to the 250 MW Oneida Energy Storage Project.
- Directing the IESO to begin planning for an additional round of energy procurements, including non-emitting electricity technologies. Increasing funding for energy-efficiency programs by $342 million, bringing total funding to more than $1 billion over the current 2021-2024 period.
- Refurbishing the Bruce and Darlington Nuclear Generating Stations, providing about 6,550 MW and 3,500 MW of capacity respectively; and supporting next steps toward the refurbishment of the four “B” units of the Pickering Nuclear Generating Station, which could provide more than 2,000 MW of capacity.
- Planning for North America’s first grid‐scale Small Modular Reactor (SMR) and the development of three additional SMRs at the Darlington site, for a total of 1,200 MW, subject to regulatory approvals.
- Starting pre-development work for the first large-scale nuclear build since 1993 at the Bruce nuclear site locating up to 4,800 MW of new nuclear generation.
Expanding Electricity Transmission
Together with the expansion of generation capacity, the Ontario government is also working with the IESO to address existing transmission bottlenecks by identifying transmission projects that should proceed with early planning and development work. These initiatives will help ensure that Ontario's growth is supported by a reliable and sustainable energy supply.
In 2022, Ontario acted to ensure the efficient and timely development of five new electricity transmission infrastructure projects in Southwestern Ontario, to be developed in phases through 2030, representing an investment of more than $1 billion. These transmission lines also present significant economic opportunities for Indigenous communities, through potential equity partnerships or other forms of participation.
Transmission infrastructure in the North is also being expanded, supporting community and economic development opportunities and improving reliability. This includes the East‐West Tie from Wawa to Thunder Bay, which went into service in March 2022; the Wataynikaneyap Power transmission project connecting 16 remote First Nations communities to Ontario’s electricity grid; and the Waasigan Transmission Line project between Shuniah (near Thunder Bay), to Atikokan and then to Dryden.
In addition, the IESO has recommended three new transmission lines that will support the growing electricity demand in Northeastern and Eastern Ontario. The new lines in the Northeast are critical to supplying Algoma Steel’s transition to electric arc furnaces and supporting additional load connections. The new line in Eastern Ontario will help improve transmission capability in the Peterborough to Quinte West area and Ottawa area.
Continuing to Power Ontario
The government is continuing to support the build out of Ontario’s clean electricity grid. With the Powering Ontario’s Growth plan and the advice provided by the Electrification and Energy Transition Panel in its report released in January 2024, the government is moving toward an integrated energy plan for Ontario to help meet the growing demand for electricity in the province. Working in partnership with Indigenous leaders and communities, as well as ensuring meaningful opportunities for consultation and Indigenous community participation in energy planning and projects, will be key to achieving these goals
Chart Descriptions
Chart 5.1: Ontario’s Labour Productivity Growth is Below the Canadian and G7 Average
Chart 5.1 depicts two illustrations. The top illustration is a map of Canada’s provinces showing the labour productivity growth average by province between 1998 and 2022, expressed as a percent.
Between 1998 and 2022, Canada recorded an average annual labour productivity growth of 1.2 per cent, British Columbia was 1.3 per cent, Alberta was 0.9 per cent, Saskatchewan was 1.2 per cent, Manitoba was 1.4 per cent, Ontario was 1.1 per cent,
Quebec was 1.1 per cent, New Brunswick was 1.0 per cent, Nova Scotia was 1.1 per cent, Prince Edward Island was 1.1 per cent and Newfoundland and Labrador was 1.4 per cent.
The bottom illustration shows a bar graph of labour productivity growth average by G7 country between 1998 and 2022 expressed as a per cent. Between 1998 and 2022, the United States recorded an annual average labour productivity growth average of 1.6 per cent, the G7 average was 1.3 per cent, Canada was 1.2 per cent, Ontario was 1.1 per cent, United Kingdom was 1.1 per cent, Japan was 1.1 per cent, Germany was 1.0 per cent, France was 0.8 per cent and Italy was 0.3 per cent.
Note: Ontario and Canada are based on Chained (2017) CDN dollars per hour while other jurisdictions are based on USD dollars per hour, constant prices, 2015 purchasing power parities. Canada recorded an average growth of 1.1 per cent using USD dollars per hour, constant prices, 2015 purchasing price power parities.
Sources: Organisation for Economic Co-operation and Development (OECD) and Statistics Canada.
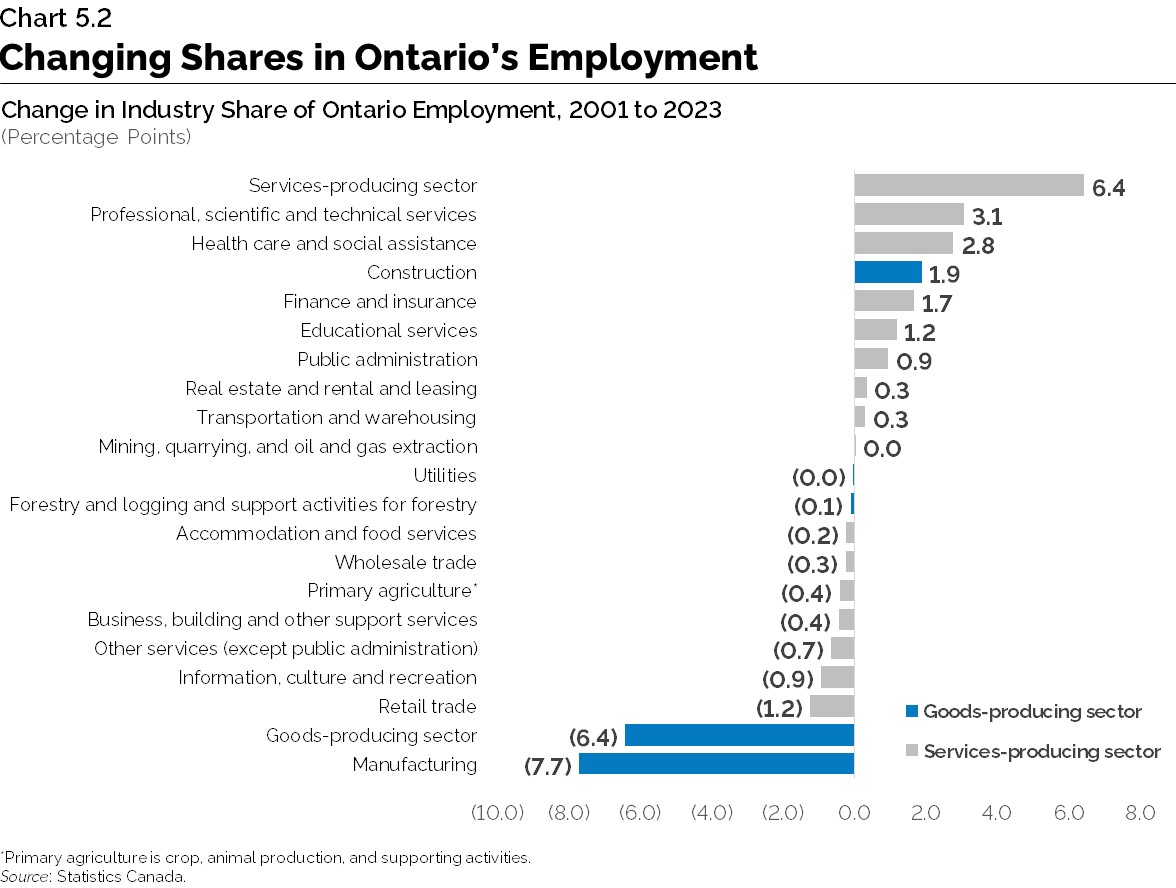
Chart 5.2: Changing Shares in Ontario’s Employment
The horizontal bar graph shows the change in employment shares across industries in Ontario from 2001 to 2023. Notably, services-producing industries experienced a 6.4 percentage points increase in employment share from 2001 to 2023. This contrasted with a 6.4 percentage points decline for goods-producing industries. The sectors with the largest share increase included professional, scientific, and technical services (+3.1 percentage points), health care and social assistance (+2.8 percentage points), and construction (+1.9 percentage points) sectors.
Conversely, the industries with the largest declines in employment share were manufacturing (-7.7 percentage points), retail trade (-1.2 percentage points), and information, culture, and recreation (-0.9 percentage points). The mining, quarrying, oil and gas extraction, and utilities witnessed almost no change in employment shares from 2001 to 2023.
Chart 5.3: Ontario GDP and Employment growth trends: 2009-2019
The chart depicts employment growth and real GDP growth for Ontario sectors between 2009-2019. The size of circles depicts the percentage of total employment that the sector represented in 2019. The 45-degree line represents points where the rate of real GDP growth is equal to the rate of job growth.
Between 2009 and 2019, aerospace manufacturing real GDP growth was -2 per cent, Accommodation and food services was 3%, Agriculture was 3 per cent, Arts, entertainment and recreation was 2 per cent, Auto Manufacturing was 5 per cent, Business Services was 3 per cent, Chemicals Manufacturing was 2 per cent, Construction was 3 per cent, Financial Services was 4 per cent, Food and Beverage mfg. was 1 per cent, Forestry was 1 per cent, ICT was 4 per cent, Information and cultural industries was 3 per cent, Life Sciences was 2 per cent, Mining was 3 per cent, Steel Manufacturing was 5 per cent.
Between 2009 and 2019, aerospace manufacturing employment growth was 3 per cent, Accommodation and food services was 2 per cent, Agriculture was -1 per cent, Arts, entertainment and recreation was 2 per cent, Auto Manufacturing was 1 per cent, Business Services was 3 per cent, Chemicals Manufacturing was -2 per cent, Construction was 3 per cent, Financial Services was 2 per cent, Food and Beverage manufacturing was 2 per cent, Forestry was -3 per cent, ICT was 2 per cent, Information and cultural industries was -2 per cent, Life Sciences was 0 per cent, Mining was 1 per cent, Steel Manufacturing was 1 per cent.
Between 2009 and 2019, aerospace manufacturing employment share was 0 per cent, Accommodation and food services was 6 per cent, Agriculture was 1 per cent, Arts, entertainment and recreation was 2 per cent, Auto Manufacturing was 2 per cent,
Business Services was 9 per cent, Chemicals Manufacturing was 0 per cent, Construction was 7 per cent, Financial Services was 6 per cent, Food and Beverage manufacturing was 2 per cent, Forestry was 1 per cent, ICT was 4 per cent, Information and cultural industries was 2 per cent, Life Sciences was 0 per cent, Mining was 0 per cent, Steel Manufacturing was 0 per cent.
Sources: Statistics Canada and Ontario Ministry of Finance.
Chart 5.4: Ontario: Supply Chain Jobs Created for Each Direct Job
The bar graph shows the weighted type 1 jobs multipliers by industry during 2019. The type I jobs multipliers show the direct and indirect impacts on jobs across the whole economy within Ontario.
Type 1 multipliers in 2019 in Ontario included: Auto manufacturing 2.9 jobs, chemical manufacturing 2.8 jobs, food and beverage manufacturing 2.8 jobs, steel manufacturing 2.3 jobs, forestry 2.1 jobs, information and cultural 2.0 jobs, financial services 1.9 jobs, life science 1.9 jobs, mining 1.9 jobs, ICT 1.6 jobs, construction 1.5 jobs, aerospace manufacturing 1.5 jobs, business services 1.4 jobs, arts, entertainment and recreation 1.4 jobs, agriculture 1.4 jobs and accommodation and food services 1.2 jobs.
Sources: Statistics Canada and Ministry of Finance.
Chart 5.5: Global Passenger Vehicles Sales by Type
The chart is a stacked bar graph representing the global market share of different vehicle types (battery electric, plug-in hybrid, hybrid and internal combustion) for the years 2022, 2025, 2030, 2035 and 2040. The values for each year in terms of millions of vehicles sold are:
2022
Battery Electric: 7 million vehicles sold
Plug-in Hybrid: 4 million vehicles sold
Hybrid: 5 million vehicles sold
Internal Combustion: 59 million vehicles sold
Total: 75 million vehicles sold
2025
Battery Electric: 16 million vehicles sold
Plug-in Hybrid: 6 million vehicles sold
Hybrid: 9 million vehicles sold
Internal Combustion: 55 million vehicles sold
Total: 86 million vehicles sold
2030
Battery Electric: 36 million vehicles sold
Plug-in Hybrid: 5 million vehicles sold
Hybrid: 15 million vehicles sold
Internal Combustion: 38 million vehicles sold
Total: 94 million vehicles sold
2035
Battery Electric: 61 million vehicles sold
Plug-in Hybrid: 0 million vehicles sold
Hybrid: 13 million vehicles sold
Internal Combustion: 26 million vehicles sold
Total: 100 million vehicles sold
2040
Battery Electric: 74 million vehicles sold
Plug-in Hybrid: 0 million vehicles sold
Hybrid: 11 million vehicles sold
Internal Combustion: 14 million vehicles sold
Total: 99 million vehicles sold
The data reveals a declining trend in the market share for Internal Combustion vehicles and Plug-in Hybrids, while Battery Electric and Hybrid vehicles show an increase in market share over the years.
Chart 5.6: Top Destinations for the ICT Workforce, North America
The chart depicts a bar graph with six bars each representing the number of ICT jobs in a North American region including California, Texas, Ontario, New York, Florida, and Virginia. California has the highest value (840,000 jobs), followed by Texas (501,000 jobs), then Ontario (404,000 jobs), with New York (285,000 jobs), Florida (242,000 jobs) and Virginia (242,000 jobs) having the lowest number of jobs.
Source: Ministry of Economic Development, Job Creation and Trade.
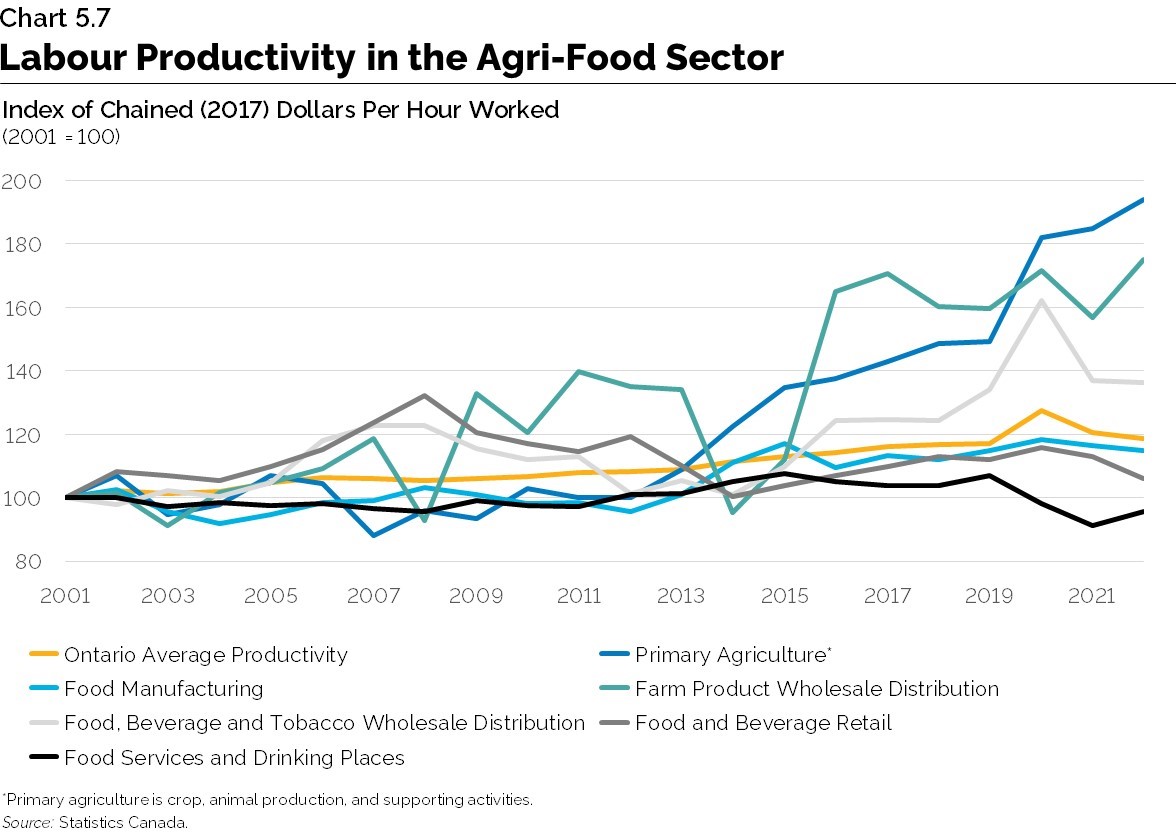
Chart 5.7: Labour Productivity in the Agri-Food Sector
The line graph depicts the progression of labour productivity in Ontario's agri-food industries from 2001 to 2022. Notably, the primary agriculture sector exhibited the highest growth in labour productivity, followed by farm product wholesale distribution and food, beverage, and tobacco wholesale distribution, all surpassing the provincial average. Conversely, the food services and drinking places experienced a decline in labour productivity over the same period.
Source: Statistics Canada.
Chart 5.8: Ontario’s Business Expenditures on R&D Increased to $13.3B in 2021
The line graph shows Ontario’s annual business R&D expenditures, including the Ministry of Finance estimate for business R&D in 2022, and business R&D intensity (R&D expenditure as a percentage of GDP) between 1997 and 2022, expressed as current prices and 2012 dollars.
Between 1997 and 2021, business R&D in Ontario has been steadily growing, increasing to a peak in 2021 of $13.3 billion. The Ministry of Finance estimates that business expenditure on R&D was $14.6 billion in 2022. Over the same period, business R&D intensity reached a high of 1.7 per cent in 2001 and has remained relatively flat. In 2021, business R&D intensity was 1.4 per cent.
Sources: Statistics Canada and the Ministry of Finance estimate.
Chart 5.9: Ontario's electricity Supply Mix
The charts graphically show the percentage shares of Ontario’s total supply mix in 2023. One shows the shares of electricity output, and the other shows shares of grid-connected generation capacity by source/fuel type.
2023 Electricity Output chart indicates the following percentages:
Nuclear – 53, Hydro -25, Gas/Oil -13, Wind – 8, Biofuel and Solar less than 1.
2023 Grid-connected capacity chart indicates the following percentages:
Nuclear – 34, Gas/Oil -27, Hydro -23, Wind – 13, Biofuel and Solar less than 1.
Source: IESO Website, https://www.ieso.ca/en/Corporate-IESO/Media/Year-End-Data
The province’s shares of total capacity by generation type does not correlate to the amount of electricity generated. Ontario’s baseload nuclear and hydroelectric fleets tend to run most often, while natural gas plants fulfil a reliability role providing electricity at times of peak demand when other generators cannot.
Chart 5.10: Annual electricity Demand
The line chart, from the IESO’s 2024 Annual Planning Outlook, illustrates the forecasted changes in annual electricity demand, in terawatt-hours, by sectors (residential, commercial, industrial, agricultural, transportation, and other) from 2025 to 2050, with the total increasing by two per cent a year, on average, from 154 terawatt-hours in 2025 to 245 terawatt-hours in 2050. The sector that is visually growing the most in electricity consumption is the transportation sector, followed by the industrial sector.
The graph shows the following net annual electricity demand in terawatt-hours (Twh ) by sector:
Residential Sector increases from 50.07 in 2025 to 62.38 in 2050.
Commercial Sector increases from 49.32 in 2025 to 61.8 in 2050.
Industrial Sector increases from 41.94 in 2025 to 62.95 in 2050.
Agricultural Sector increases from 4.88 in 2025 to 7.94 in 2050.
Transportation Sector increases from 2.18 in 2025 to 43.89 in 2050.
Other Electricity Demand increases from 5.46 in 2025 to 6.42 in 2050.
Chart 5.11: Electricity supply Adequacy Outlook
Two bar charts illustrating two potential outlooks for the province’s ability to meet electricity needs over the period from 2025 to 2050: the As Is case and the High Nuclear case, from the IESO’s 2024 Annual Planning Outlook. The charts show an electricity supply shortfall, compared to the projected electricity demand, in terawatt-hours per year, starting in about 2029, with a larger shortfall, and growing, for the As Is case versus the High Nuclear case. In the As Is case, the shortfall grows to 132 terawatt-hours by 2050, while in the High Nuclear case, the shortfall is 74 terawatt-hours by 2050.
Chart 5.12: Electricity Demand: IESO 2024 Annual Planning Outlook Compared to Pathways to Decarbonization
The line chart highlights how the Pathways to Decarbonization (P2D) scenario demand compares with the 2024 Annual Planning Outlook (APO) forecast. The 2024 APO shows a demand of 153.86 terawatt-hours in 2025 increasing to 245.37 terawatt-hours in 2050. The P2D scenario shows a demand of 152.66 terawatt-hours in 2025 increasing to 293.8 terawatt-hours in 2050.
Footnotes
- footnote[1] Back to paragraph Organisation for Economic Co-operation and Development, OECD Employment Outlook 2017 (2017), https://www.oecd-ilibrary.org/employment/oecd-employment-outlook-2017_empl_outlook-2017-en
- footnote[2] Back to paragraph Organisation for Economic Co-operation and Development, “OECD Employment Outlook 2017, (2017),” https://www.oecd-ilibrary.org/employment/oecd-employment-outlook-2017_empl_outlook-2017-en
- footnote[3] Back to paragraph A Type I multiplier indicates the direct and indirect impacts of the output of a given industry across the whole economy; for instance, for one job created in a given industry, how many jobs are created across the whole economy.
- footnote[4] Back to paragraph Trillium Network for Advanced Manufacturing, Canada’s Manufacturing Sector: A Decade in Review, (2020) https://trilliummfg.ca/wp-content/uploads/2020/08/Trillium_CanadasManufacturingSector-ADecadeinReview-August2020_FA-justify.pdf
- footnote[5] Back to paragraph Ontario 360, Made in Ontario: A Provincial Manufacturing Strategy, (2021), https://on360.ca/policy-papers/made-in-ontario-a-provincial-manufacturing-strategy/.
- footnote[6] Back to paragraph Ibid.
- footnote[7] Back to paragraph Bloomberg New Energy Finance, Electric Vehicle Outlook 2023, (2023) https://about.bnef.com/electric-vehicle-outlook/
- footnote[8] Back to paragraph Ernst & Young, “Critical minerals supply and demand challenges mining companies face, (April 2022),” https://www.ey.com/en_ca/mining-metals/critical-minerals-supply-and-demand-challenges
- footnote[9] Back to paragraph Primary Metal Manufacturing: Ontario 2022-2024, https://www.jobbank.gc.ca/trend-analysis/job-market-reports/ontario/sectoral-profile-primary-metal-manufacturing
- footnote[10] Back to paragraph Canadian Manufacturers and Exporters, Canada’s Net Zero Industrial Strategy, (June 2022), https://cme-mec.ca/wp-content/uploads/2022/06/Final_CME-Net-Zero-Report_June-2022-.pdf
- footnote[11] Back to paragraph ,For example, OmniaBio, located at the McMaster Innovation Park in Hamilton, Ontario, will be a commercial-scale cell and gene therapy facility operating as a contract development and manufacturing organization (CDMO). A CDMO works with other life sciences companies to commercialize and manufacture their products, allowing companies to focus on research for new therapies and medical breakthroughs and on growing their business.
- footnote[12] Back to paragraph Venture Ontario, “2021-22 Annual Report, (2022),” https://www.ventureontario.ca/assets/images/partners/OCGC-Annual-Report-2021-22.pdf
- footnote[13] Back to paragraph Ministry of Economic Development, Job Creation and Trade
- footnote[14] Back to paragraph Information & "Communications Technology" Council, Ontario’s Next Gen Industry, (April 19, 2023) https://ictc-ctic.ca/reports/ontarios-next-gen-industry
- footnote[15] Back to paragraph Quantum technologies include computing hardware and software, communications and sensors all based on the principles of quantum science.
- footnote[16] Back to paragraph Ministry of Economic Development, Job Creation and Trade.
- footnote[17] Back to paragraph Invest Ottawa, Communications Technology, https://whyottawa.ca/communications-technology/#:~:text=Ottawa%20has%20the%20highest%20concentration,the%20Canadian%20Photonics%20Fabrication%20Centre
- footnote[18] Back to paragraph Unifor, "Telecommunications Sector" Profile, https://www.unifor.org/resources/our-resources/telecommunications-sector-profile
- footnote[19] Back to paragraph Ministry of Economic Development, Job Creation and Trade.
- footnote[20] Back to paragraph McKinsey & Company, "The Economic Potential of Generative AI (2023)", https://www.mckinsey.com/capabilities/mckinsey-digital/our-insights/the-economic-potential-of-generative-ai-the-next-productivity-frontier#introduction
- footnote[21] Back to paragraph Ibid.
- footnote[22] Back to paragraph The financial services sector refers to NAICS Code 52 – Finance and Insurance, which includes establishments primarily engaged in financial transactions, i.e. transactions involving the creation, liquidation, or change in ownership of financial assets or in facilitating financial transactions.
- footnote[23] Back to paragraph Invest Ontario, Financial Services, Financial services | Invest Ontario.
- footnote[24] Back to paragraph Organisation for Economic Co-operation and Development,Organisation for Economic Co-operation and Development, Productivity and ULC by main economic activity (ISIC Rev.4), https://stats.oecd.org/Index.aspx?DataSetCode=PDBI_I4
- footnote[25] Back to paragraph CD Howe Institute, “Productivity and the Financial Sector - What's Missing?” (April 2018), p. 1.
- footnote[26] Back to paragraph Ibid., p. 7.
- footnote[27] Back to paragraph Bank of England, “Customer data access and fintech entry: early evidence from open banking” Staff Working Paper No. 1,059, (February 2024), p. 4; PwC Canada, “What open banking means for Canada’s financial landscape.” (2019) https://www.pwc.com/ca/en/industries/banking-capital-markets/canadian-banks-2019/what-open-banking-means-for-canada-financial-landscape.html
- footnote[28] Back to paragraph Deloitte, “Canada leads the world in AI talent concentration” (2023), https://www2.deloitte.com/ca/en/pages/press-releases/articles/impact-and-opportunities.html; Invest Ontario, 14 AI companies to watch, https://www.investontario.ca/spotlights/14-ai-companies-watch-2022-23
- footnote[29] Back to paragraph Ontario Securities Commission, Artificial Intelligence in Capital Markets: Exploring Use Cases in Ontario (2023), p. 6 https://oscinnovation.ca/resources/Report-20231010-artificial-intelligence-in-capital-markets.pdf
- footnote[30] Back to paragraph Ontario Ministry of Agriculture, “Food and Rural Affairs,” https://www.ontario.ca/page/ontario-agriculture-and-food-statistics
- footnote[31] Back to paragraph Ontario Ministry of Agriculture, Food and Rural Affairs.
- footnote[32] Back to paragraph McKinsey & Company, “Trends Driving Automation on the Farm, (May 31, 2023),” https://www.mckinsey.com/industries/agriculture/our-insights/trends-driving-automation-on-the-farm
- footnote[35] Back to paragraph Ontario Ministry of Agriculture, Food and Rural Affairs, (November 28, 2022), https://www.ontario.ca/page/grow-ontario-provincial-agri-food-strategy
- footnote[36] Back to paragraph According to Statistics Canada, IPP includes three components: mineral exploration and evaluation; research and development; and software products.
- footnote[37] Back to paragraph Research InfoSource Inc.
- footnote[38] Back to paragraph Statistics Canada and Organisation for Economic Co-operation and Development
- footnote[39] Back to paragraph WIPO, “Global Innovation Index 2023” (2023) https://www.wipo.int/edocs/pubdocs/en/wipo-pub-2000-2023/ca.pdf
- footnote[40] Back to paragraph Statistics Canada and U.S. Bureau of Economic Analysis.
- footnote[41] Back to paragraph Porter, M. E. Porter, M. E. "Clusters and the new economics of competition” (1998), Vol. 76, No. 6, pp. 77-90, Boston: Harvard Business Review.
- footnote[42] Back to paragraph Forbes “Applications of Artificial Intelligence Across Various Industries”, (2023) https://www.forbes.com/sites/qai/2023/01/06/applications-of-artificial-intelligence/?sh=709ed4ec3be4; World Economic Forum, “4 Ways Artificial Intelligence Could Transform Manufacturing,” (2023) https://www.weforum.org/agenda/2023/01/4-ways-artificial-intelligence-manufacturing-davos2023/; World Economic Forum (2023), “4 ways AI is revolutionising the construction industry” https://www.weforum.org/agenda/2023/06/4-ways-ai-is-revolutionising-the-construction-industry/
- footnote[43] Back to paragraph Deloitte, "Canada leads the world in AI talent concentration", (2023) https://www2.deloitte.com/ca/en/pages/press-releases/articles/impact-and-opportunities.html
- footnote[44] Back to paragraph The APO’s population growth assumptions are informed by bi-annual provincial and Ontario regional economic outlooks provided by Stokes Economics.
-
footnote[45]
Back to paragraph
IESO Annual Planning Outlook, March 2024
https://www.ieso.ca/en/Sector-Participants/Planning-and-Forecasting/Annual-Planning-Outlook - footnote[46] Back to paragraph Powering Ontario’s Growth, July 2023. https://www.ontario.ca/files/2023-07/energy-powering-ontarios-growth-report-en-2023-07-07.pdf
- footnote[47] Back to paragraph IESO, “Pathways to Decarbonization, (December 15, 2022),” https://www.ieso.ca/en/Learn/The-Evolving-Grid/Pathways-to-Decarbonization, p. 3