Chapter 4: Delivering Infrastructure for Long-Term Growth 2024
Introduction
Investment in public infrastructure is a critical component to supporting Ontario’s future economic prosperity. This chapter explains the importance of infrastructure to help sustain the province’s long-term growth, the role the government plays to drive future infrastructure investments, as well the challenges and opportunities that Ontario faces to meet its infrastructure needs in the coming decades.
The government is continuing to explore strategies that optimize and help deliver infrastructure investment. This will help ensure that Ontario is well-positioned to continue supporting communities, people and businesses and creating a strong foundation for Ontario’s long-term economic growth.
Infrastructure Driving Long-Term Economic Growth
Infrastructure helps drive economic activity in all sectors of the economy, supporting the flow of goods and services, linking businesses to markets and connecting people to their communities and lowering costs for people and businesses. Investing in infrastructure is critical to supporting long-term economic growth and sustaining Ontario’s overall prosperity.
The rapid growth in Ontario’s population means that the province needs to make substantial investments in infrastructure to maintain the condition of existing assets and to build new infrastructure that supports a larger population and growing economy.
According to a study by The Centre for Spatial Economics (C4SE), the return on investment of infrastructure spending in Ontario was between $3.06 and $5.98 (in discounted present value of GDP) for every $1 spent on infrastructure
Ontario’s Infrastructure Portfolio
The effective delivery of infrastructure in Ontario, as in all jurisdictions, requires a close partnership between the public and private sectors. The majority of infrastructure in Ontario is owned by the private sector and includes buildings such as factories and warehouses, rail corridors and rail freight rolling stock, and long-lived assets such as machinery and equipment, among others. Public-sector infrastructure, where ownership is primarily by one of the federal, provincial or local governments, or government business enterprises or corporations, includes roads and bridges, public transit, electricity transmission and distribution, water, wastewater, health care and educational assets, among others. Other infrastructure such as long-term care homes and energy generation, is owned and operated by a mix of public and private sector bodies.
The provincial government is largely responsible for providing urban transit, highway, bridge, hospital and education assets, for which Ontario currently owns (or consolidates) about $300 billion in infrastructure. This represents one-third of all public infrastructure in Ontario, of which municipal governments, the federal government and other partners own 55 per cent, 7 per cent and 5 per cent respectively.

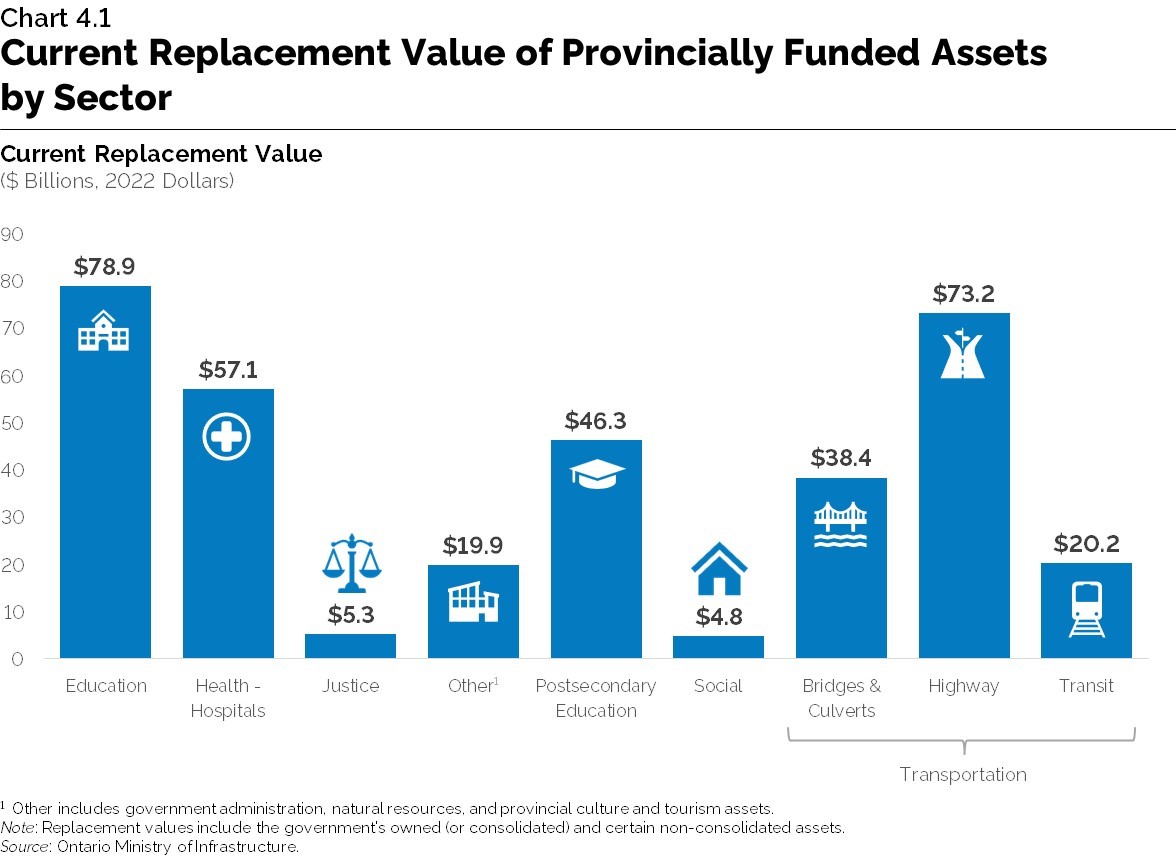
Ontario invests in a large and diverse asset portfolio, either directly or indirectly through partners such as school boards and hospital corporations. Chart 4.1 shows the distribution of provincial public infrastructure’s current replacement value by sector, which is defined as the estimated cost of replacing those assets to their existing functional utility at today’s prices.
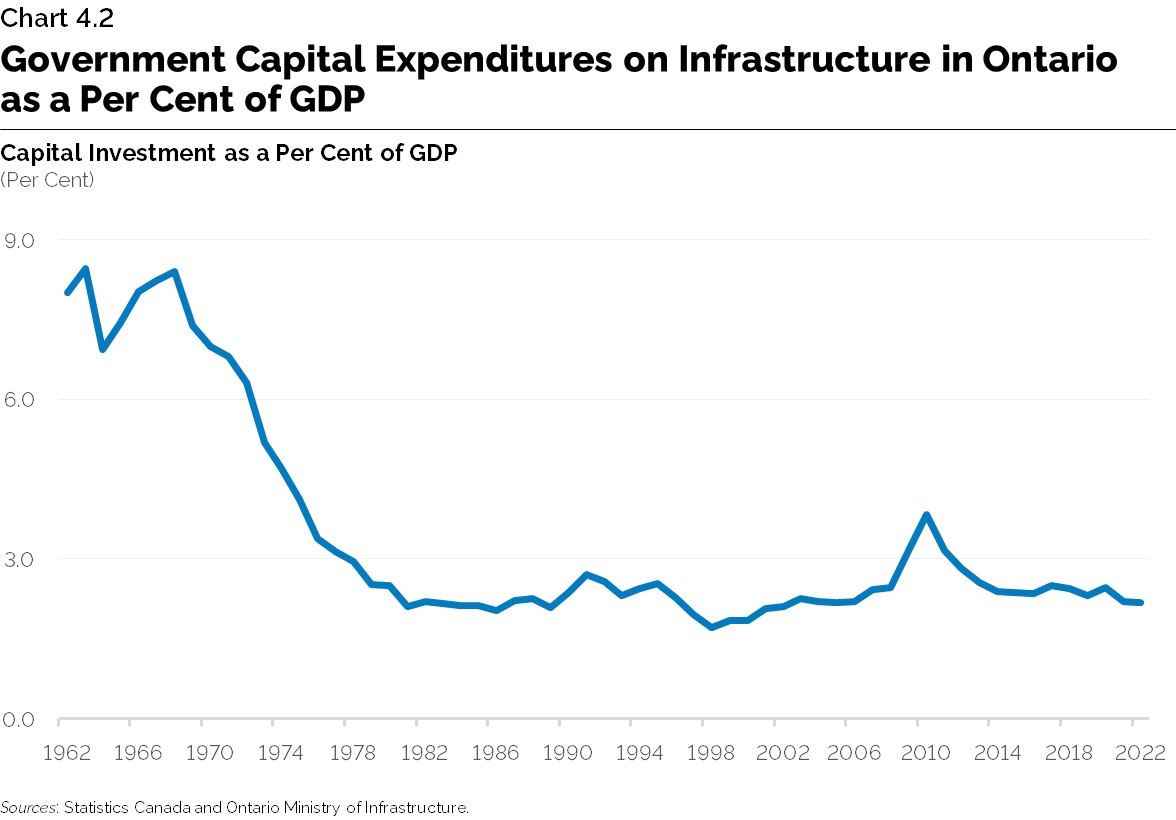
Following an early peak after World War II, infrastructure investment lagged in Ontario through the 1980s to the early-to-mid 2000s. After a significant spike in response to the 2008 financial crisis, capital investment has since remained stable at an average of about 2.4 per cent of GDP over the last decade. CHART 4.2 shows infrastructure investment trends in Ontario relative to GDP between 1962 and 2022.
Over Ontario’s current 10-year plan, the government’s spending on infrastructure is planned to be over $190 billion to help expand or renew infrastructure in Ontario and strengthen Ontario’s economy. These include investments in infrastructure projects to support schools, hospitals, public transit, roads, bridges and access to high-speed internet.
As per the 2024 Ontario Budget, the largest planned infrastructure expenditure over the next 10 years, starting in 2024-25, is allocated for transit (at 35.5 per cent), followed by health and long‑term care (22.5 per cent), highways and other transportation (15.1 per cent), education (10.5 per cent), other sectors including high-speed internet, government administration, natural resources and culture and tourism industries (11.3 per cent), justice (2.2 per cent), social (1.8 per cent) and postsecondary (1.3 per cent).
Recent announcements include Ontario’s investment over 10 years of $67.5 billion in public transit, nearly $50 billion to support more than 50 hospital projects that would add approximately 3,000 new beds, more than $1.8 billion in housing-enabling infrastructure funding, and $1.3 billion to support construction and expansion of 60 schools across the province.
Challenges and Opportunities to Support the Delivery of Infrastructure
The province continually faces pressures to renew and extend the useful life of its infrastructure, as public assets such as buildings, roads, and bridges physically deteriorate or require modernization. Ontario’s public infrastructure also needs to expand significantly to meet the needs of Ontario’s growing population and ensure its public assets can effectively support the growing economy. Investment in infrastructure is critical as Ontario’s population is projected to grow rapidly, rising from 15.6 million in 2023 to 21.7 million in 2046, a 39 per cent increase over the next 23 years. See Chapter 1: Demographic Trends and Projections.
In addition to these factors, the following section discusses a number of other considerations and opportunities that could support the delivery of infrastructure needed to sustain long-term growth.
Increasing Efficiency and Productivity in Infrastructure Planning and Delivery
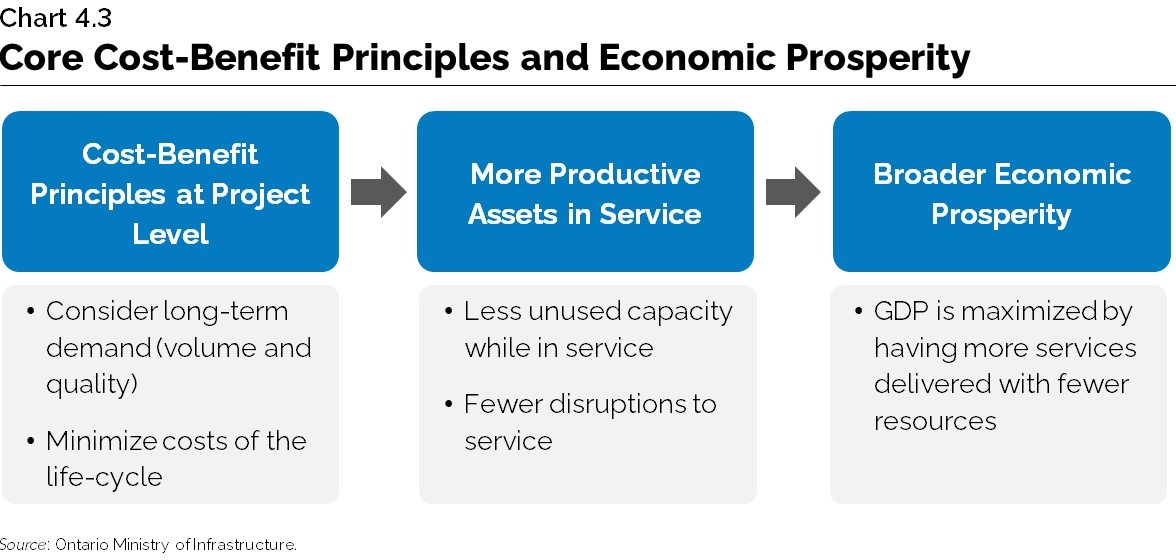
The Ontario government focuses on number of core guiding cost-benefit principles for infrastructure investments, such as considering asset maintenance, long-term demand and minimizing life-cycle costs. As shown in CHART 4.3, cost-benefit analyses provide guiding principles to help ascertain the broader economic implications of infrastructure investments.
The government is advancing the use of data to inform infrastructure investment decisions by: centralizing relevant data and identifying best practices across government; standardizing data and definitions to make comparisons more meaningful; and building and using models to forecast infrastructure needs. In addition, the government has enabled other innovations in infrastructure planning that help manage infrastructure costs more effectively.
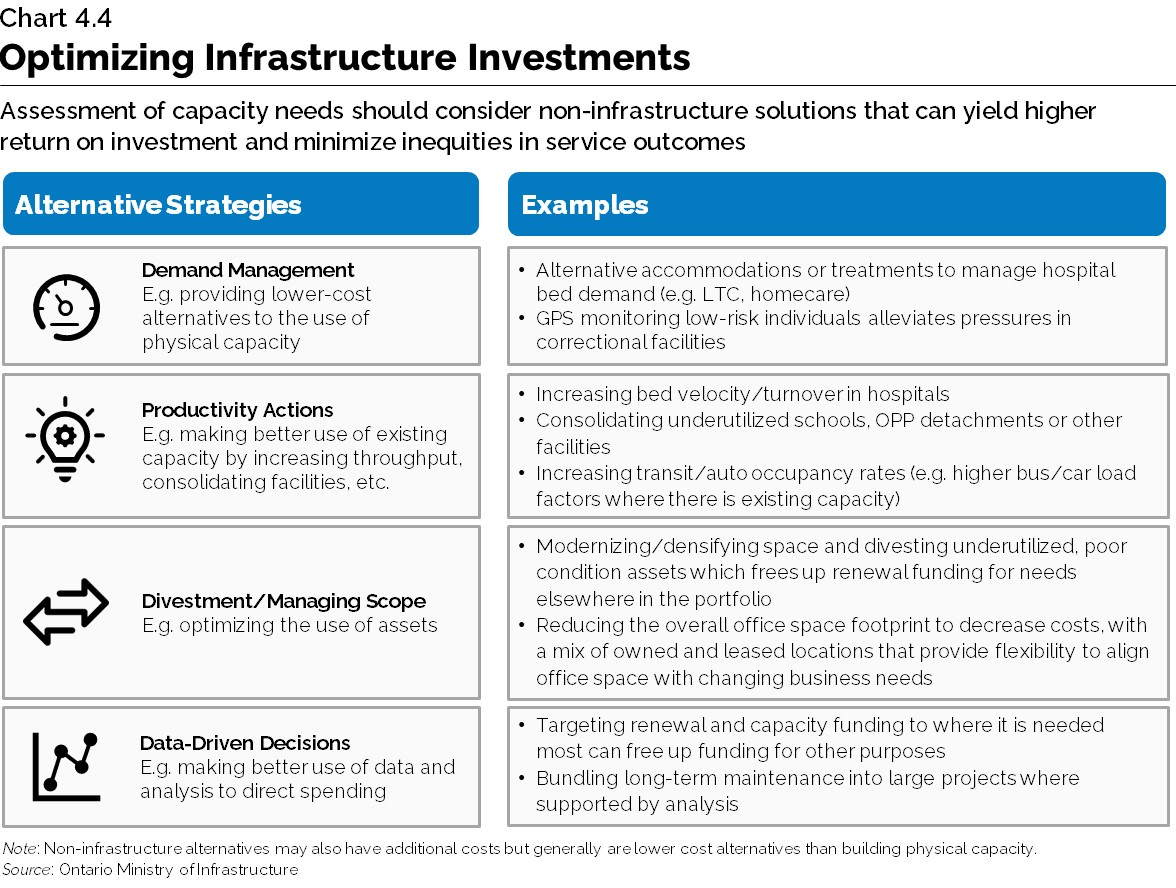
As part of its long-term planning, the government is also exploring alternative opportunities and innovations to help optimize and enhance its infrastructure capacity. As shown in Chart 4.4, alternative strategies can help to lower the cost per unit of output (e.g., cost per passenger-kilometre, patient, case, student, etc.), ultimately realizing cost savings for Ontarians as well as increases to productivity and long-term economic growth.
Enhancing Construction Sector Productivity
Labour productivity within the construction sector has remained relatively stagnant, with an annual average growth rate of -0.1 per cent between 1998 and 2022, compared to 1.1 per cent across all business sector industries.
There are a number of potential opportunities to address the productivity challenges faced by the sector. Higher levels of education and skills have been associated with increases in productivity
Embracing Technological Change
Technology adoption may also help to address productivity challenges while helping to increase safety and efficiency and address potential recruitment challenges in the construction sector. A 2023 survey of 275 Canadian construction companies found that 86 per cent of companies were considering investments in technology, such as prefabrication and modularization to increase efficiency and address labour challenges.
Next generation technology and innovation can also support the delivery of public services by creating more efficient and interoperable public infrastructure that can meet the evolving needs of Ontarians. However, disruptive technologies can also alter infrastructure utilization after it is built, providing both opportunities and challenges for infrastructure investment. While disruptive technologies have the potential to boost productivity in other ways, this highlights the need to remain adaptable in Ontario's long-term infrastructure planning.
Illustrated Examples of How Disruptive Technologies Impact Infrastructure Utilization
![]()
Automated Vehicles (AV) have the potential to significantly increase road capacity and, as a result, reduce congestion (even with a corresponding increase in total vehicle activity). One study estimates that the potential congestion cost savings in Canada are in the range of $5 billion. On the other hand, AVs have the potential to stimulate new vehicle activity, thereby adding to, rather than reducing, congestion.
![]()
![]()
![]()
Addressing the Impact of a Changing Climate
Ontario is not immune to the changing global climate. The evolving climate hazards are expected to raise the costs associated with the upkeep of Ontario's public infrastructure portfolio. Climate hazards are accelerating asset deterioration, which potentially compromises system reliability and threatens health and safety. Ontario’s Financial Accountability Office (FAO) studied the financial impact of climate related costs on provincial and municipal infrastructure assets. The FAO’s research projects that in the absence of proactive or reactive adaptation, these changing climate hazards will add up to $4.1 billion per year on average to the cost of maintaining Ontario’s portfolio of existing public infrastructure.
Funding and Financing Infrastructure Investments
As demand for infrastructure grows, the challenge of finding finding new sources of both funding and financing for infrastructure will persist. This has and will continue to require new and more innovative sources of infrastructure funding and financing.
Although related, infrastructure funding and financing are distinct concepts where infrastructure funding refers to the source of money that will be used to pay for building, improving, and maintaining infrastructure, and infrastructure financing refers to the financial instruments (bonds, equity, etc.) that are used to bridge the gap between the timing of building infrastructure and when infrastructure funding money becomes available.
For public infrastructure, the financing source is typically through government bonds, which are paid back through future government revenues that are generated through general taxation or user fees. More recently, it has become increasingly common for private financing to be used to finance large infrastructure projects.
That is why the government announced the creation of Ontario’s new infrastructure bank, the Building Ontario Fund. The Building Ontario Fund is a new arms-length, board-governed agency that will create opportunities for public sector pension plans, other trusted institutional investors and Indigenous communities to further participate in large-scale infrastructure projects across the province.
Other jurisdictions have taken a similar approach to support infrastructure investments, such as Canada (Canada Infrastructure Bank), the U.K. (UK Infrastructure Bank), the United States (California Infrastructure and Economic Development Bank (IBank) and Connecticut Green Bank), and Germany (KfW).
The government has allocated an initial $3 billion to the Building Ontario Fund to support the financing and building of critical infrastructure projects. The Building Ontario Fund is developing a detailed process to ensure there is appropriate criteria for selecting projects and partners in priority areas, including long-term care homes, energy infrastructure, affordable housing, municipal and community infrastructure, and transportation.
Institutional investor participation will help the government deliver more infrastructure faster, while leveraging additional capital from investors and helping to maintain a responsible fiscal plan for today and the future.
Role of Government to Drive Future Infrastructure Investment
Effective infrastructure asset management is needed to improve productivity, enhance resiliency and increase economic growth. The government’s focus on improving its asset management provides the basis for guiding infrastructure investments to ensure efficient delivery and sustainability of Ontario’s public infrastructure.
The government is making significant investments in transit, highway expansion, health care, education and high-speed internet access across the province. With over $190 billion in infrastructure investments planned over its current 10-year capital plan, the government is delivering to ensure infrastructure is reliable and resilient to support Ontario’s economy and its people’s quality of life.
Chart Descriptions
Chart 4.1: Current Replacement Value of Provincially Funded Assets by Sector
This column chart shows the estimated current replacement values (or CRV), in 2022 dollars, of public infrastructure owned or consolidated by the government, as well as non-consolidate sectors such as universities and social services. The chart is broken out for each major provincial public sector. Transportation sectors, in aggregate, have the highest total CRV with a total of $131.7 billion. It is made up of highways and roads at $73.2 billion, bridges and culverts at $38.4 billion, and transit at $20.2 billion. This group of sectors is followed by education at $78.9 billion, hospital health care at $57.1 billion, postsecondary education at $46.3 billion, justice at $5.3 billion, community and social services at $4.8 billion and a combined total of $19.9 billion for other sectors such as government administration, natural resources, and culture and tourism.
Source: Ontario Ministry of Infrastructure.
Chart 4.2: Government Capital Expenditures on Infrastructure in Ontario as a Per Cent of GDP, 1962 to 2022
This line chart shows the change in government investments into capital as a per cent of gross domestic product (GDP) in Ontario from 1962 to 2022. The chart starts at a high between 6.9 per cent and 8.5 per cent of GDP in the 1960s and gradually decreases to a low of 1.7 per cent in 1998. The chart then rises to a peak of 3.8 per cent in 2010 before levelling out at 2.2 per cent by 2022.
Sources: Statistics Canada and Ontario Ministry of Infrastructure.
Chart 4.3: Core Cost-Benefit Principles and Economic Prosperity
The figure illustrates a flowchart on how cost-benefit principles flow into having broader economic impacts.
The first category involves cost-benefit principles at the project level. This considers long-term demand (volume and quality) and minimizing costs over the life-cycle. This flows into the impact of more productive assets in service which results in less unused capacity while in service and fewer disruptions to services. Finally, the figure flows into broader economic prosperity where GDP is maximized by having more services delivered with fewer resources.
Source: Ontario Ministry of Infrastructure.
Chart 4.4: Optimizing Infrastructure Investments.
This dashboard describes how assessment of capacity needs should consider non-infrastructure solutions that can yield higher return on investment and minimize inequities in service outcomes.
The left side of the dashboard provides a list of broad alternatives which includes:
- Demand management (for example, providing lower-cost alternatives to the use of physical capacity).
- Productivity actions (for example, making better use of existing capacity by increasing throughput, consolidating facilities, et cetera).
- Divestment or managing scope (for example, optimizing the use of assets).
- Data-driven decisions (for example, making better use of data and analysis to direct spending).
The dashboard provides example strategies for alternatives to increasing infrastructure investments, some of which are already partially in use.
Demand management could include:
- Alternative accommodations or treatments to manage hospital bed demand (such as long-term care and homecare).
- GPS monitoring low-risk individuals alleviates pressures in correctional facilities.
Productivity actions could include:
- Increasing bed velocity/turnover in hospitals.
- Consolidating underutilized schools, OPP detachments or other facilities.
- Increasing transit/auto occupancy rates (for example, higher bus/car load factors where there is existing capacity).
Divestment or scope management could include:
- Modernizing/densifying space and divesting underutilized, poor condition assets which frees up renewal funding for needs elsewhere in the portfolio.
Reducing the overall office space footprint to decrease costs, with a mix of owned and leased locations that provide flexibility to align office space with changing business needs.
Data-driven decisions could include:
- Targeting renewal and capacity funding to where it is needed most can free up funding for other purposes.
- Bundling long-term maintenance into large projects where supported by analysis.
It is noted that non-infrastructure alternatives may also have additional costs but generally are lower cost alternatives than building physical capacity.
Footnotes
- footnote[1] Back to paragraph The Centre for Spatial Economics, “The Economic Benefits of Public Infrastructure Spending in Ontario, (March 2017),” http://www.c4se.com/documents/Ontario%20Public%20Infrastructure%20Final%20Report.pdf.
- footnote[2] Back to paragraph Other partners include transfer payment partners such as universities and long-term care facilities. All public infrastructure, measured by its replacement value (the cost of rebuilding the infrastructure from scratch in today’s dollars) is valued at $900 billion, for which Ontario owns or consolidates about one-third. Source: Statistics Canada, Ontario Capital Ministries, Ontario Municipal Asset Management Plans, and Ontario Ministry of Infrastructure
- footnote[3] Back to paragraph These estimates are primarily derived through engineering assessments conducted for capital ministries, which are in turn inflated to a common base year.
- footnote[4] Back to paragraph Includes interest capitalized during construction; third-party investments in hospitals, colleges and schools; federal and municipal contributions to provincially owned infrastructure investments; and transfers to municipalities, universities and non-consolidated agencies.
- footnote[5] Back to paragraph Statistics Canada. Note that the construction sector includes residential building construction, non-residential building construction, engineering construction, repair construction and other activities of the construction industry. The business sector includes all goods and services producing industries with the exception of the owner-occupied dwellings industry and public administration.
- footnote[6] Back to paragraph McKinsey & Company “Reinventing Construction: A Route to Higher Productivity, (2017)”
- footnote[7] Back to paragraph Égert, B., C. de la Maisonneuve and D. Turner, “A new macroeconomic measure of human capital exploiting PISA and PIAAC: Linking education policies to productivity”, (2022), OECD Economics Department Working Papers, No. 1709, OECD Publishing, Paris,
- footnote[8] Back to paragraph KPMG & Canadian Construction Association (2023). Cue construction 4.0: Make-or-break time: An In-Depth Look at Technology Adoption in Canada’s construction industry.
- footnote[9] Back to paragraph Ibid.
- footnote[10] Back to paragraph CPCS, Untapped Road Capacity, https://www.caa.ca/app/uploads/2021/05/Infrastructure_Papers-RideshareCarpool-ENG-V3.pdf.
- footnote[11] Back to paragraph Financial Accountability Office (FAO), Costing Climate Change Impacts to Public Infrastructure: Summary Report,https://fao-on.org/web/default/files/publications/EC2302%20CIPI%20Summary/CIPI%20Summary-EN.pdf.