Chapter 3: Fiscal Trends and Projections 2024
Introduction
This chapter describes the potential impact of demographic and economic trends on the public sector and Ontario’s fiscal policy. Based on the demographic and economic projections presented in the previous chapters, there are three key implications for the future:
- Rising demand for certain public services due to demographic and economic factors;
- Lower revenue growth than in the past arising from slower than historical economic growth; and
- Ongoing measures will be required to support sustainability of the province’s finances.

Past Trends in Ontario Government Services and Finances
Historical revenue and spending developments provide context and have implications for future trends in the province’s public finances. This section discusses historical trends in:
- Demand for public services;
- Government revenues;
- Government fiscal balances;
- Government debt; and
- Debt financing costs.
Demand for Public Services
Demographics, including population growth, as well as the age and gender composition of the population, is a significant driver of demand for public services. Other demand drivers include utilization rates and delivery costs of existing programs and the introduction of new programs.

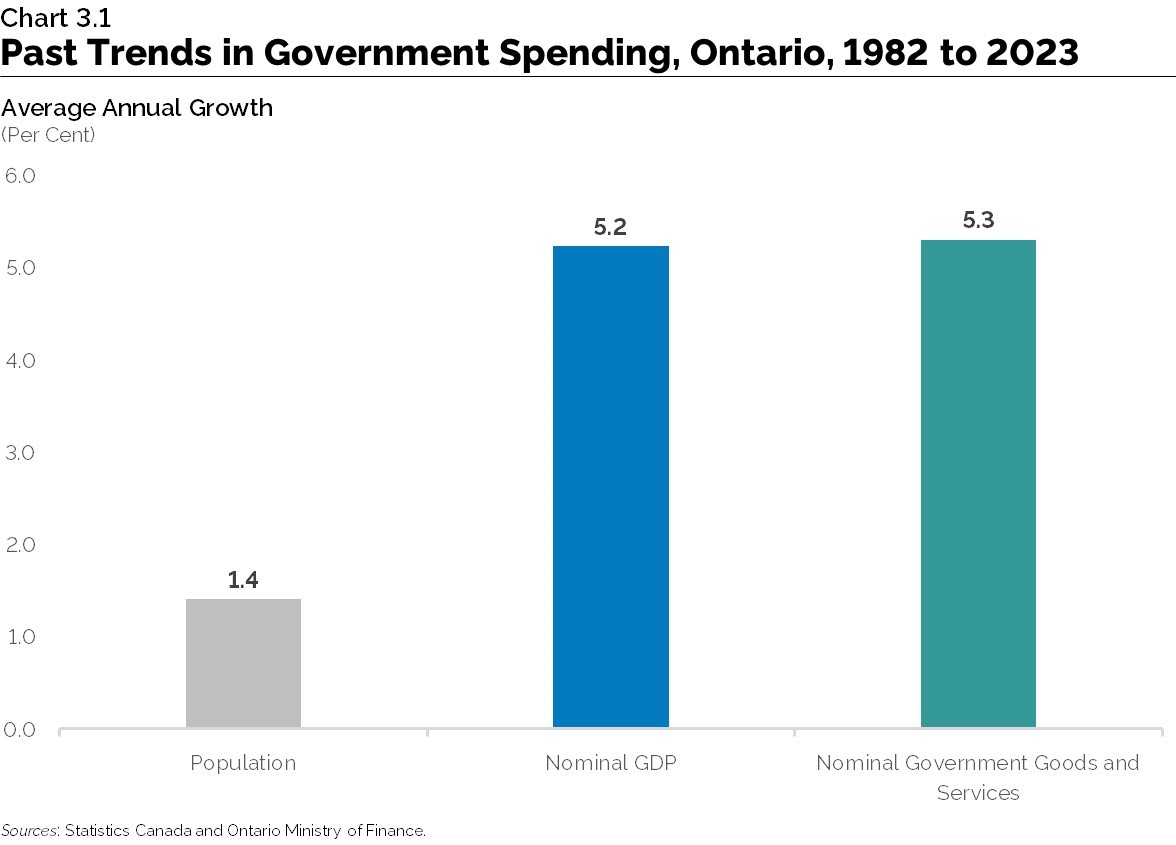
Government spending on goods and services by all levels of government in Ontario has grown at an average annual rate of 5.3 per cent over the past four decades. Over this period, the government spending growth rate has been significantly faster than population growth and slightly higher than growth in Ontario’s overall economy as measured by nominal gross domestic product (GDP). Factors driving the rise in government spending include: an aging population; rising demand for public services; and increasing service delivery costs.
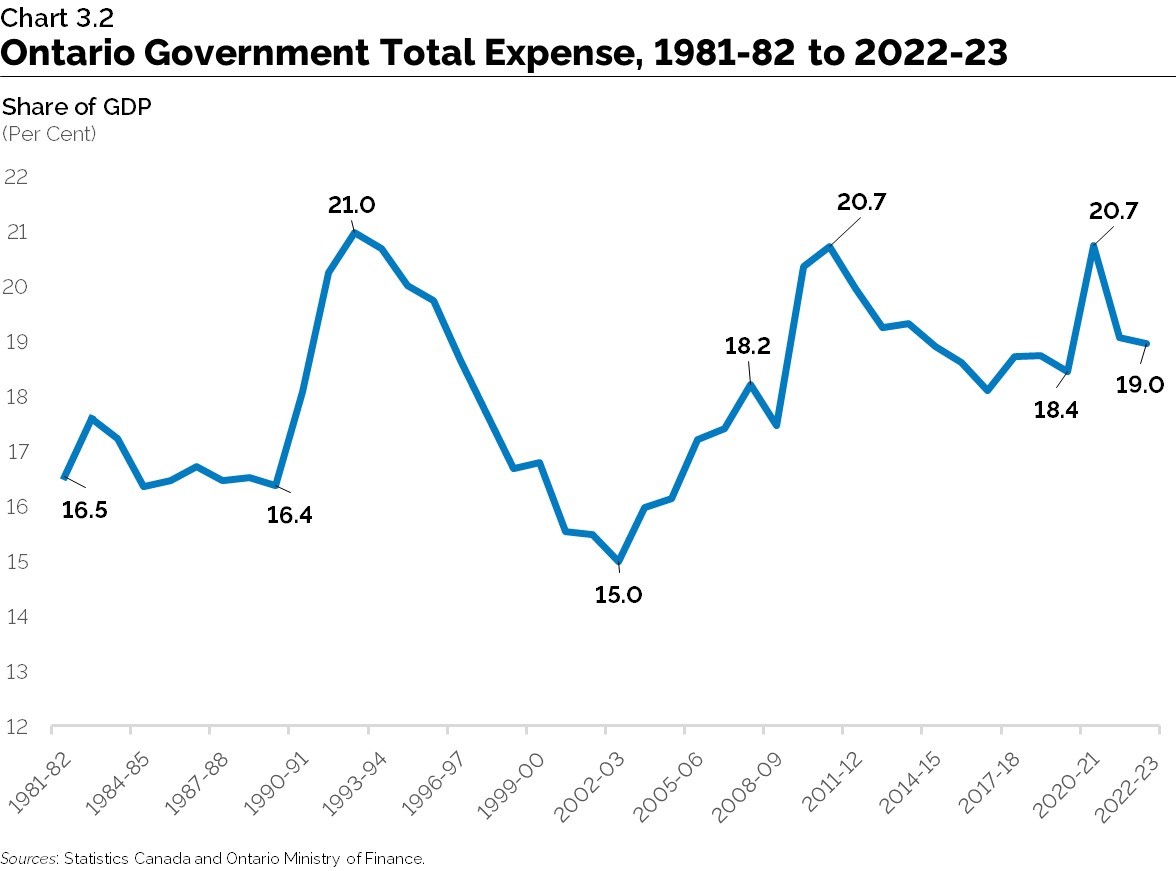
Total Ontario government expenses, including program spending and interest-on-debt, have risen as a share of the economy from 16.5 per cent of nominal GDP in 1981-82 to 19.0 per cent in 2022-23. The share rose from 16.4 per cent in 1989-90 to 21.0 per cent in 1992-93, corresponding with an economic recession and high interest rates. The share then trended downwards to 15.0 per cent by 2002-03 before again moving upwards over the following decade, reaching a peak of 20.7 per cent in 2010-11 in the wake of the global financial crisis and recession. The total expense-to-GDP ratio has subsequently remained relatively stable, averaging 19.1 per cent between 2011-12 and 2022-23. The share rose from 18.4 per cent in 2019-20 to 20.7 per cent in 2020-21 during the COVID-19 pandemic and subsequently declined. In 2023-24 the total expense-to-GDP ratio is projected to be 19.0 per cent of GDP, modestly higher than the pre-pandemic share of 18.4 per cent in 2019-20.
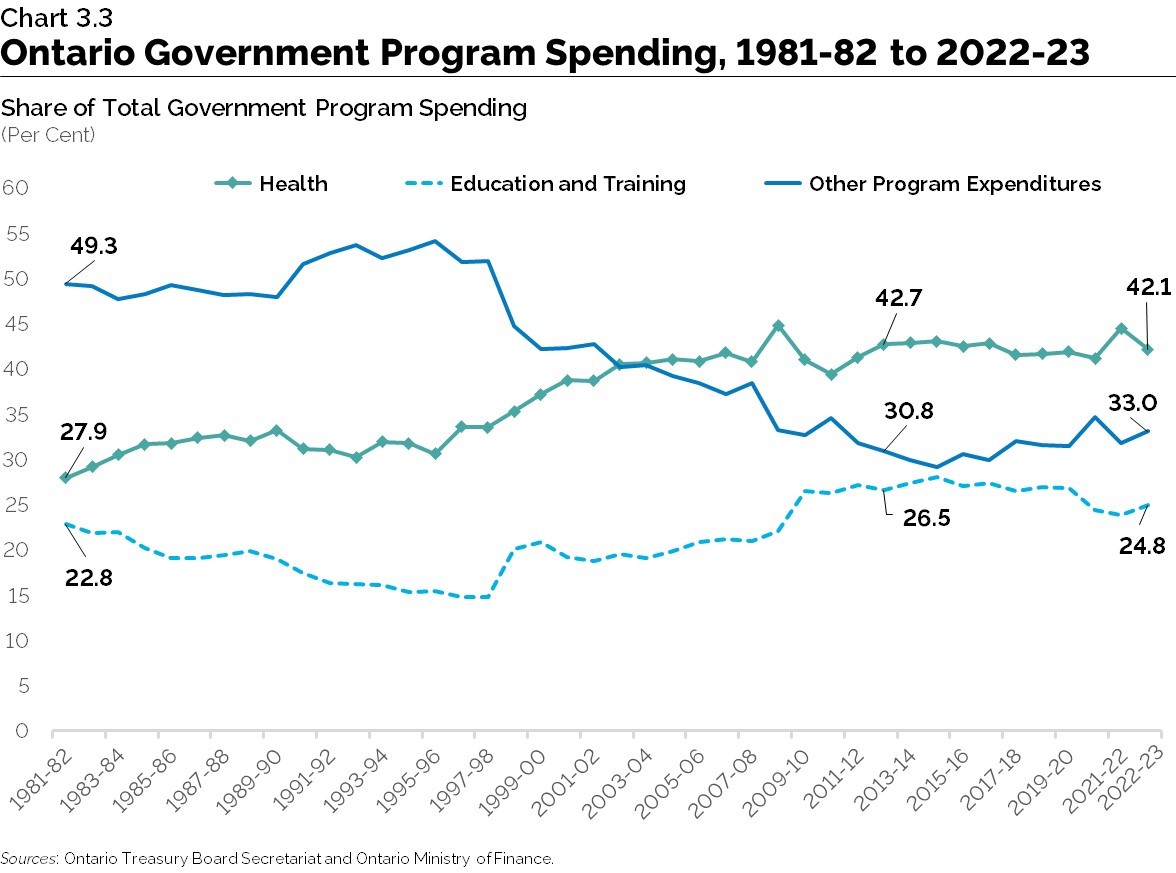
In 2022-23, the health care sector constituted the largest single share of total Ontario program spending at 42.1 per cent, followed by education and training at 24.8 per cent. Between 1981-82 and 2012-13, the share of health spending in total program spending gradually increased from 27.9 per cent to 42.7 per cent and the share of education and training in program spending increased from 22.8 per cent to 26.5 per cent. Over the 2012-13 to 2022-23 period, the share of health spending in total program spending has eased modestly from 42.7 per cent to 42.1 per cent while the share of education and training has declined from 26.5 per cent to 24.8 per cent. By contrast, the remaining program expenditures increased as a share of total program spending over the past decade, rising from 30.8 per cent in 2012-13 to 33.0 per cent in 2022-23 following three decades of declining shares.
Government Revenues
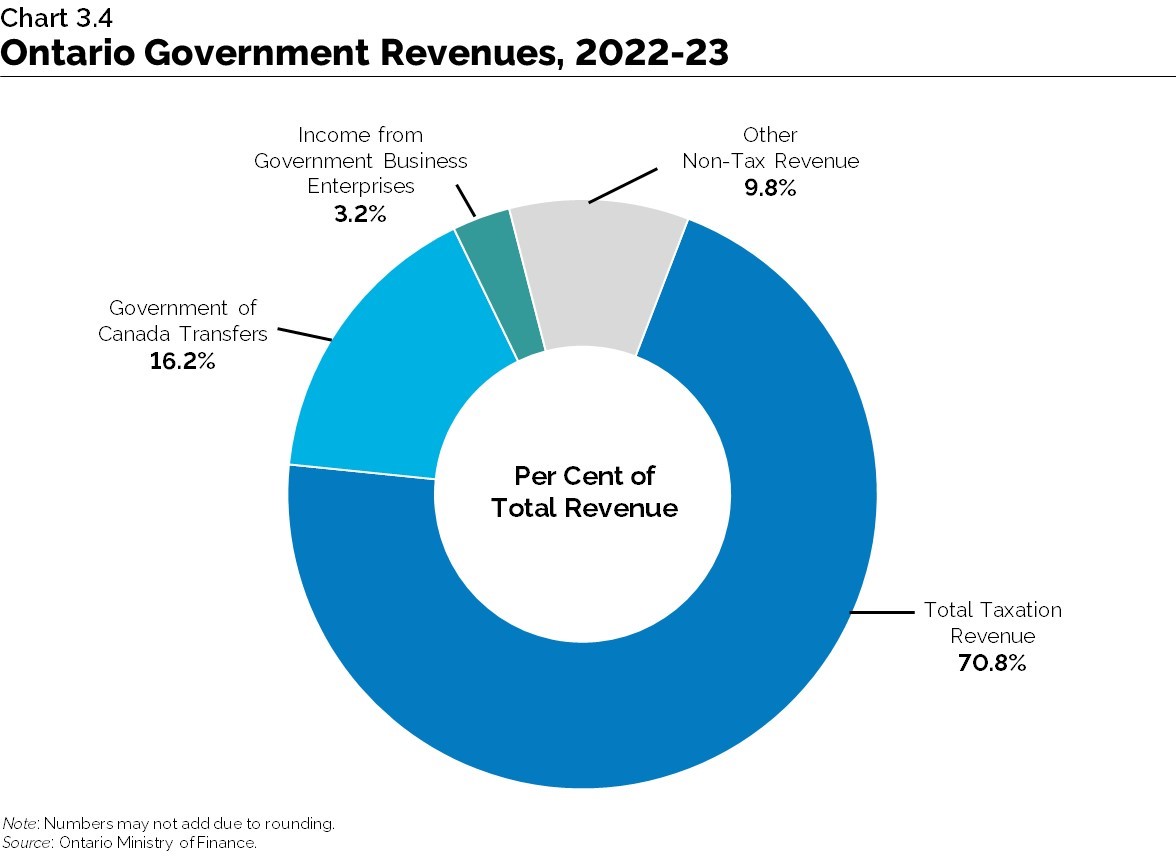
Taxation revenues accounted for 70.8 per cent of Ontario government revenues in 2022-23, followed by federal transfers to Ontario at 16.2 per cent. Federal transfers include major Government of Canada transfers such as the Canada Health Transfer and the Canada Social Transfer, funding for infrastructure projects and labour market programs. Net income from Government Business Enterprises (GBEs) comprised 3.2 per cent of total government revenues in 2022-23. Other non-tax revenues, covering a variety of revenue sources from fees, licences and permits, royalties for the use of Crown resources and miscellaneous revenues, comprised 9.8 per cent of total provincial revenues in 2022-23.
Taxation revenues as a share of total government revenues rose from 69.3 per cent in 1981-82 to 81.1 per cent by 1990-91 and remained close to this level for most of the 1990s. Between 1997-98 and 2010-11, the taxation revenues share of total revenues declined from 81.2 per cent to 63.1 per cent. Since 2010-11, the taxation revenues share rose gradually to 70.8 per cent by 2022-23.
These trends in the taxation revenues share of total government revenues were generally matched by opposing trends in federal transfers to Ontario. Between 1981-82 and 1998-99, federal transfers to Ontario as a share of total government revenues declined from 16.4 per cent to 7.2 per cent. However, rising federal transfers to Ontario for most of the 2000s helped to increase these transfers’ share of total revenues to 20.5 per cent in 2010-11. Since 2010-11 federal transfers to Ontario have not kept pace with nominal GDP and total provincial revenue growth, with federal transfers' share of total government revenues declining to 16.2 per cent by 2022-23. Other non-tax revenues as a share of total government revenues declined from 11.2 per cent in 1981-82 to a low of 4.9 per cent in 1990-91. Since then, other non-tax revenues as a share of total government revenues have risen, increasing to a peak of 13.7 per cent in 2009-10 before declining to 9.8 per cent by 2022-23. Some of this growth was due to accounting changes from consolidating broader public sector organizations on the province’s financial statements.
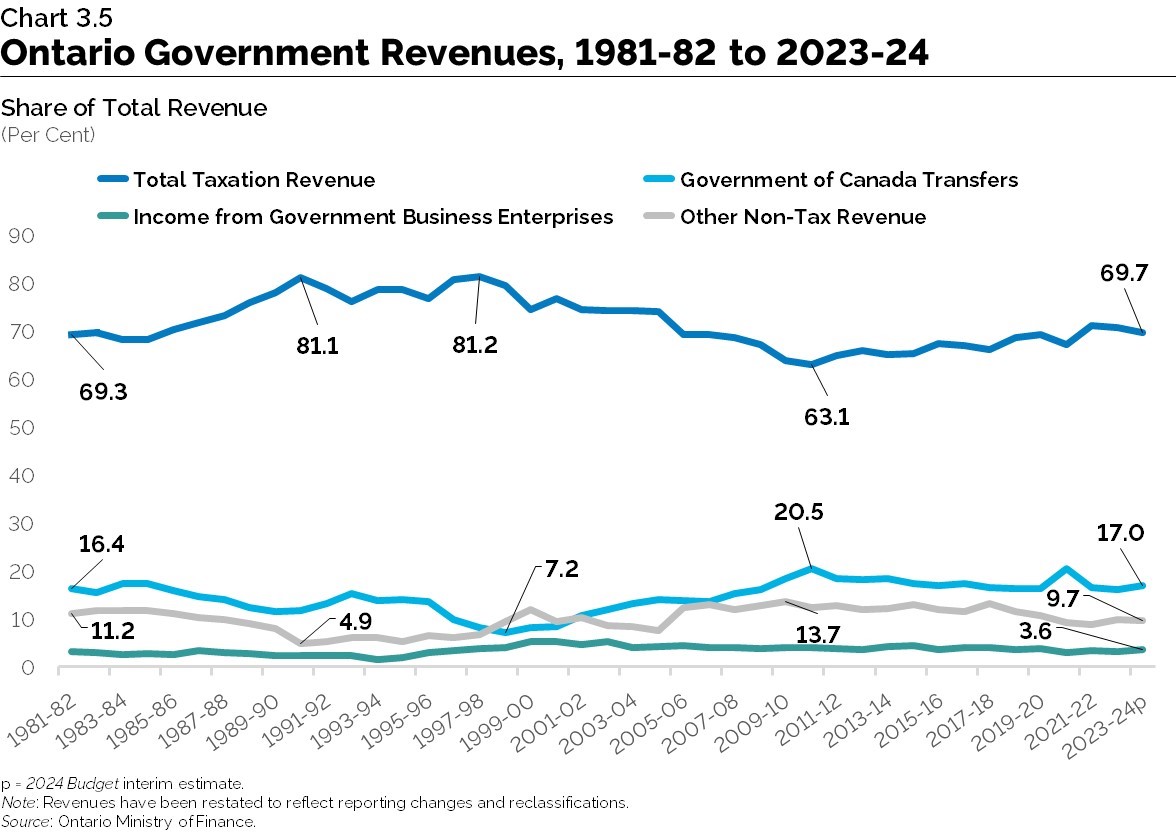
Federal transfers to Ontario as a share of total provincial revenues have trended downward in recent years and accounted for 17.0 per cent of revenues in 2023-24. The forecast for federal transfers is largely based on existing federal-provincial funding agreements and formulas. Federal transfers as a share of total revenues are projected to be slightly higher over the next few years relative to their share in 2023-24. While the long-term trend in federal transfers is uncertain, a further risk exists if current transfers and future agreements are not adapted to reflect anticipated demographic change and growth in demand for public services, as well as expected provincial expenditure pressures.
Net income from Government Business Enterprises (GBEs) comprised 3.6 per cent of Ontario government revenues in 2023-24. The outlook for net income from GBEs is based on Ontario Ministry of Finance estimates of net income for Hydro One Ltd. (Hydro One) and projections provided by Ontario Power Generation (OPG), the Ontario Cannabis Store (OCS), the Liquor Control Board of Ontario (LCBO), the Ontario Lottery and Gaming Corporation (OLG) and iGaming Ontario (iGO). The net income from GBEs share of total provincial revenues is projected to average 3.5 per cent over the next few years. Since many GBEs are mature businesses, over the long term, growth in their net income is expected to be in line with economic growth.
Other non-tax revenues accounted for 9.7 per cent of total provincial revenues in 2023-24 and this share is expected to decline in the near term. The near-term outlook for other non-tax revenues is based on projections provided by Ontario government ministries and agencies. Over the near term, other non-tax revenues are expected to decline largely due to the decrease in third-party revenues from Broader Public Sector Colleges reflecting the federal government’s cap on international student study permit applications for two years, beginning in 2024. Over the long term, most non-tax revenues are expected to grow in line with total population growth and inflation.
Government Fiscal Balances
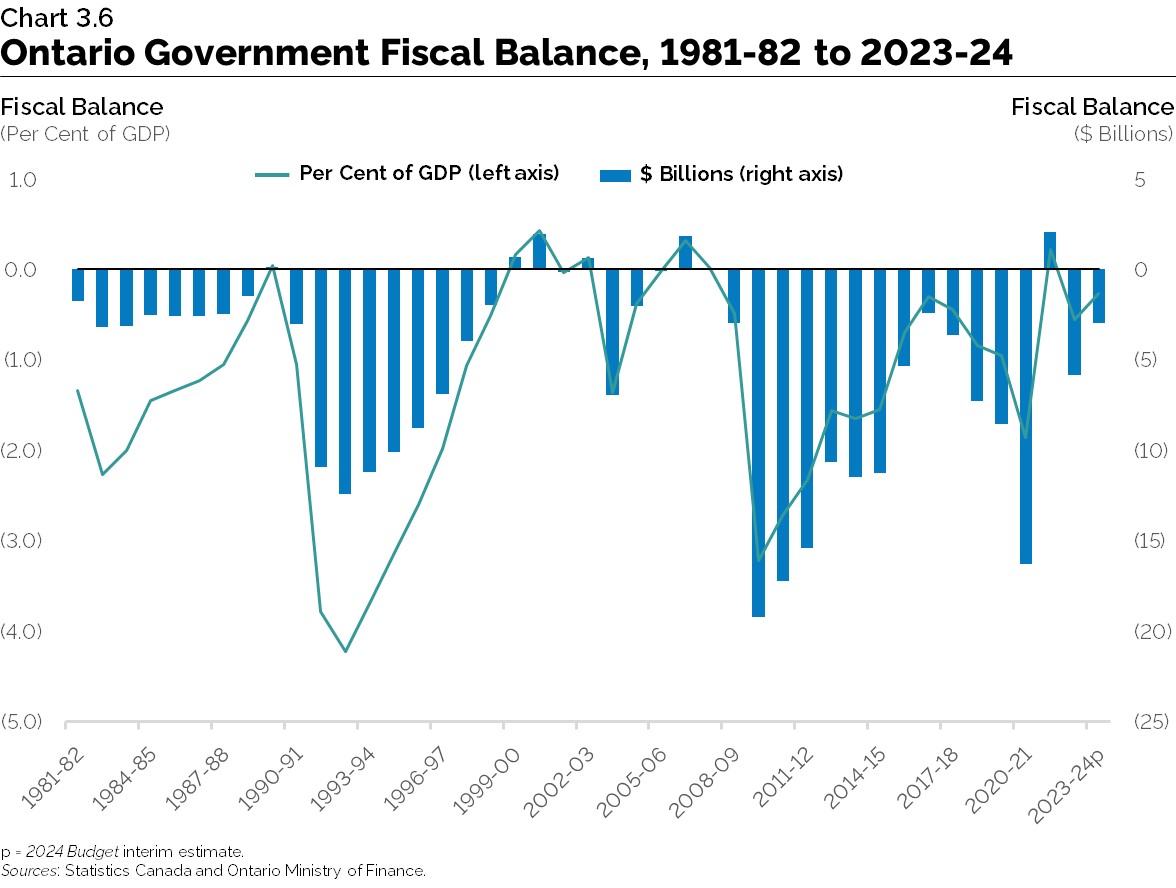
Between 1981-82 and 2022-23, the province’s finances have been in deficit in 35 out of the 42 years. There has been a tendency for large fiscal deficits to emerge as a consequence of economic downturns. In the recession in the early 1990s, Ontario’s fiscal balance deteriorated from a balanced budget in 1989-1990 to a deficit of 4.2 per cent of GDP in 1992-1993. During the 2007-09 global financial crisis, the fiscal balance deteriorated from a surplus of 0.3 per cent of GDP in 2006-07 to a deficit of 3.2 per cent of GDP in 2009-10. The fiscal balance remained in deficit for more than a decade following the financial crisis.
The fiscal balance improved much more quickly following the most recent recession in 2020 caused by the COVID-19 pandemic. The sharp decline in the fiscal balance in 2020-21 to a deficit of 1.9 per cent of GDP returned to a surplus the following year before declining to an estimated modest projected deficit of 0.3 per cent of GDP in 2023-24.
Government Debt
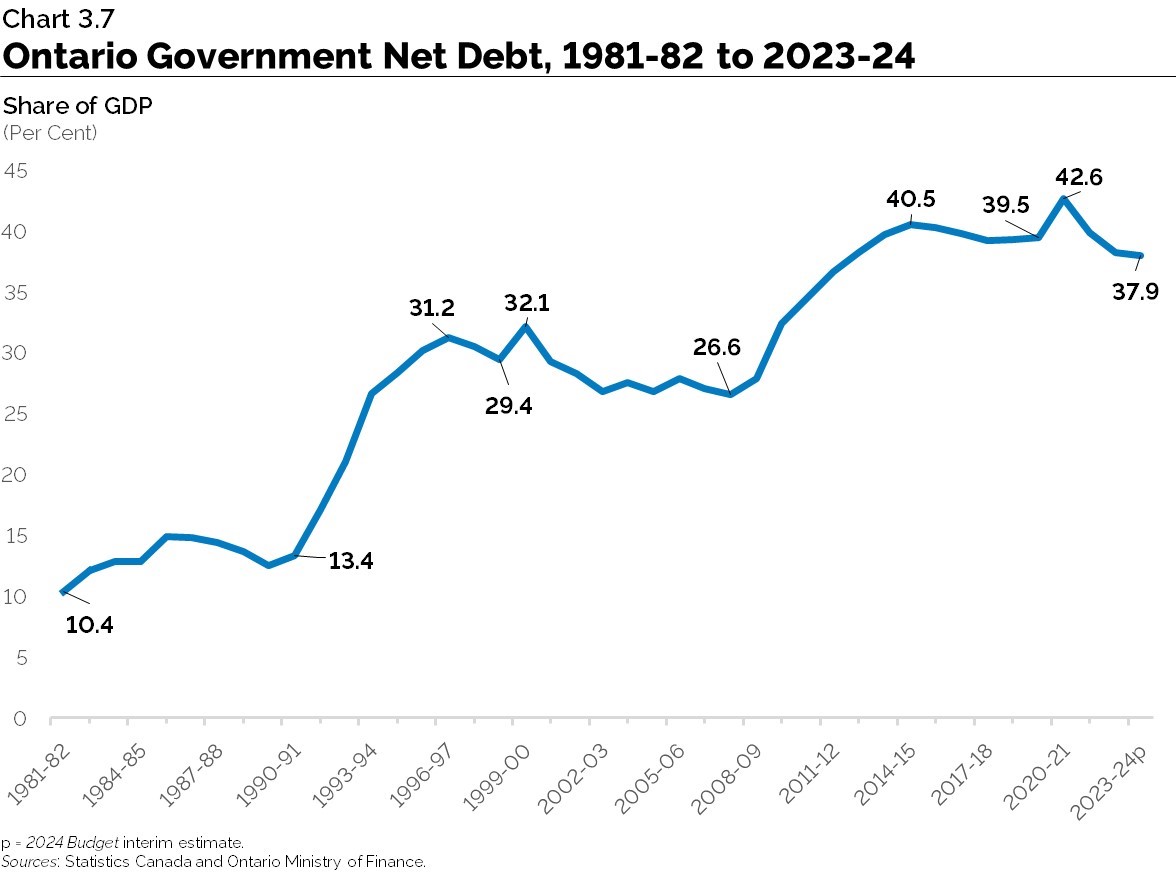
Ontario’s net debt rose significantly over the past four decades. As in many other jurisdictions, Ontario’s debt levels rose during past recessions, including following recessions in the early 1980s, in 1990-91, in 2008-09 and in 2020. Over the same period, net debt has risen due to increased investments in infrastructure to meet Ontario’s growing population needs.
Ontario’s net debt-to-GDP ratio, a measure of the relationship between a government’s obligations and its ability to meet them, has also risen over the past four decades. The ratio has tended to increase following recessions without subsequently returning to pre-recessionary levels. The ratio rose from 10.4 per cent in 1981-82 to 13.4 per cent in 1990-91. Following the recession in the early 1990s, the ratio rose to 31.2 per cent in 1996-97 before declining to 29.4 per cent by 1998-99. It then again rose, reaching 32.1 per cent in 1999-2000 before trending downwards, reaching 26.6 per cent in 2007-08. The ratio then trended upwards again, reaching 40.5 per cent in 2014-15 and subsequently stabilized until it rose to 42.6 per cent in 2020-21 during the COVID-19 pandemic. Unlike previous recessions, the net debt-to-GDP ratio declined following the 2020 recession and is estimated to be 37.9 per cent in 2023-24.
Debt Financing Costs
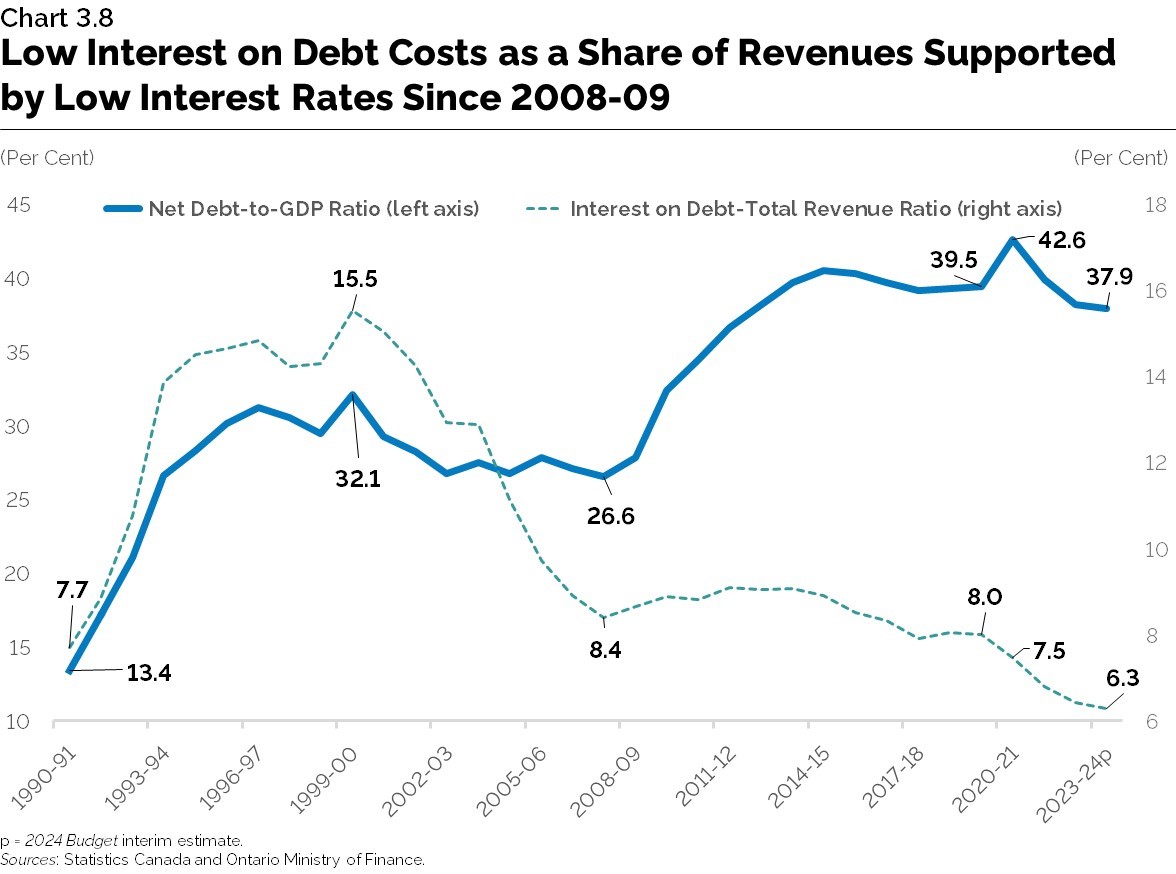
The interest on debt-to-total revenue ratio, a measure of fiscal sustainability, trended upwards from 7.7 per cent in 1990-91 to 15.5 per cent in 1999-2000, both due to rising debt levels and relatively high interest rates. Subsequent declines in interest rates helped reduce the interest on debt-to-total revenue ratio to 8.4 per cent by 2007-08, despite only a modest decline in the net debt-to-GDP ratio. Since the 2008-09 recession, debt service costs in Ontario have been supported by low interest rates. Despite rising net debt as a share of GDP, the ratio of interest on debt-to-total revenues continued to trend downwards and is estimated to be 6.3 per cent in 2023-24.
Implications of Demographic and Economic Trends for Public Services
This section examines how projected demographic and economic trends would influence the future demand for public services, and the corresponding implications for provincial government finances.
Demand for Public Services
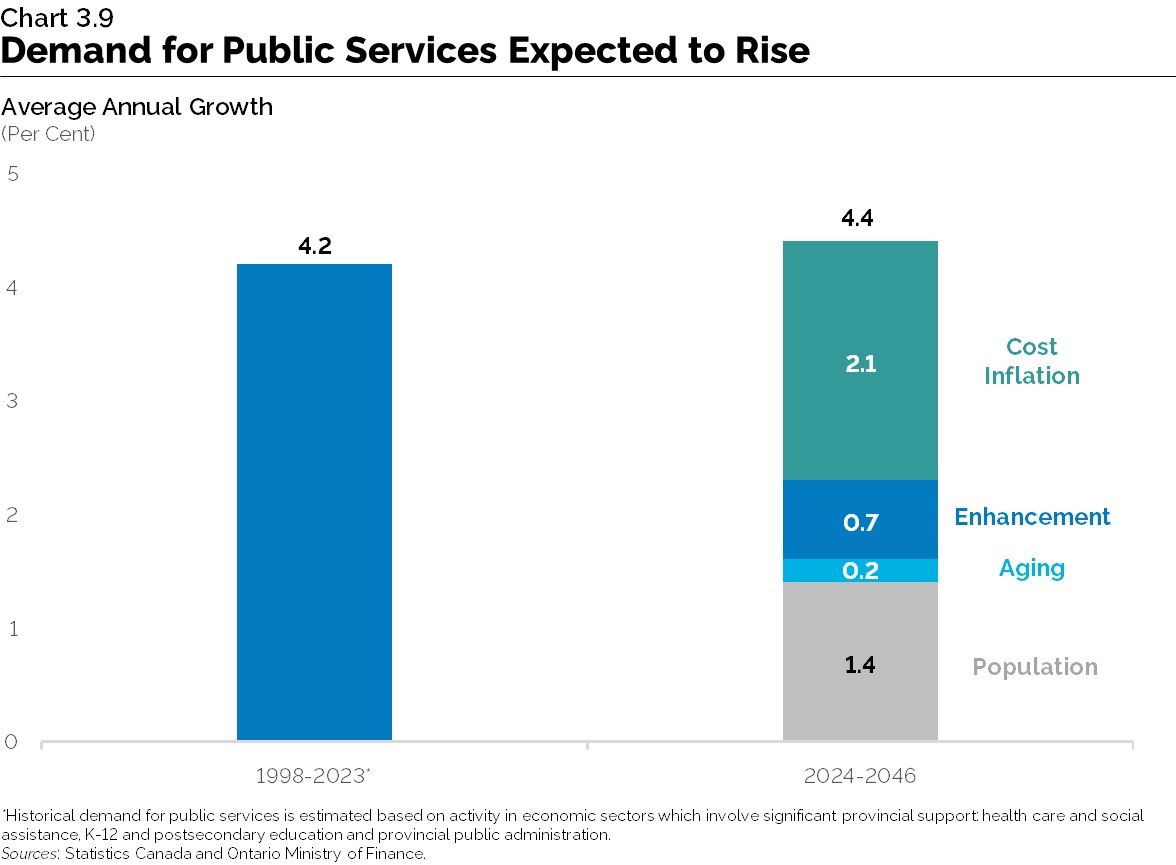
Demand for services provided by the Government of Ontario is expected to rise at an annual rate of 4.4 per cent over the long term, higher than the 4.2 per cent average annual growth rate between 1998 and 2023. The projection for total demand is based on four main components: underlying demographic demand reflecting population growth; demand related to aging of the population; enhancement of programs based on past trends; and cost inflation.
Population
Chapter 1: Demographic Trends and Projections described how Ontario’s population is expected to continue rising rapidly over the next quarter century. Population growth is expected to be driven largely by immigrants and non-permanent residents. From 2023 to 2046, population growth in Ontario is projected to average 1.4 per cent annually.
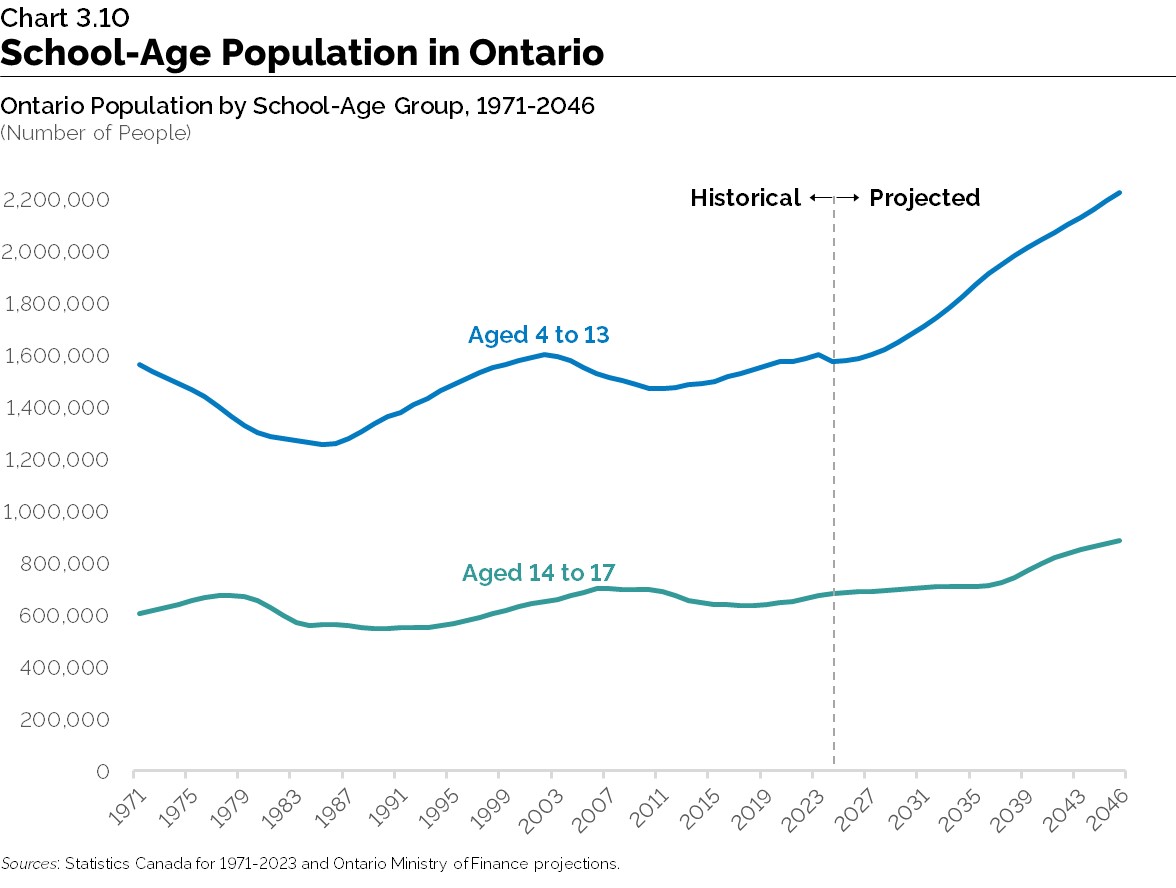
The population growth of specific age groups will influence demand for sector-specific public services. For example, from 2023 to 2046, the number of elementary school-age children is projected to rise by about 1.4 per cent annually, on average. The 4 to 13 age group is projected to grow by 38.9 per cent from 1.60 million in 2023 to 2.23 million in 2046 — significantly greater than the 0.4 per cent, or 7,000 increase seen over the past 20 years.
The secondary school-age group (aged 14 to 17 years) is projected to continue growing in the short term, and to reach 884,000 by 2046 — 31.1 per cent higher than today’s level of 674,000. Due to regional variations in the growth of the children’s population, school enrolment will rise in some regions and fall in others.
Aging
Ontario’s population is projected to experience an overall aging due to low fertility rates, aging of large cohorts of baby boomers and rising life expectancy. Significant aging will also take place within the 65+ population, with a larger proportion of seniors in the older age groups. See Chapter 1: Demographic Trends and Projections, Section 4.
Spending per person on health care for seniors is significantly higher than for the remaining population. In Ontario, government health spending per person on seniors (65 years and above) was $12,433 per person in 2021 relative to the average amount of $5,227 per person for the entire population.
A number of key drivers affect the demand for, and cost of, health care services. The key drivers are demographics (population growth and aging), population health status, patients’ expectations, inflation, technology and clinical practice.
With a projected population increase of 6.08 million by 2046, a significant increase in the number of seniors and aging within the 65+ age group in the province, demand for the appropriate services and programs also increase.
Health care costs make up 42.1 per cent of the province’s total program expense. Other jurisdictions are experiencing similar trends, which are likely to continue in the future.
| Age Group | Spending per Person 2021 ($) | Share of Population 2021 (per cent) | Share of Population 2046 (per cent) |
|---|---|---|---|
| <1 | 15,368 | 0.9 | 1.0 |
| 1 - 4 | 2,410 | 3.9 | 4.1 |
| 5 - 14 | 2,207 | 10.7 | 10.2 |
| 15 - 44 | 3,129 | 39.8 | 41.0 |
| 45 - 64 | 4,719 | 26.6 | 23.4 |
| 65 - 84 | 10,430 | 15.7 | 15.7 |
| 85+ | 26,076 | 2.3 | 4.6 |
| Total | 5,227 | 100 | 100 |
Sources: Canadian Institute for Health Information and Ontario Ministry of Finance
In 2023, seniors accounted for 18.3 per cent of the province’s overall population, with approximately 2.9 million Ontarians aged 65 or older. As noted in Chapter 1: Demographic Trends and Projections, the number of seniors living in Ontario is projected to increase by 54 per cent between 2023 and 2046. By 2046, seniors are projected to number 4.4 million and constitute a share of 20.3 per cent of Ontario’s population.
Inflation
Demand for public services is also impacted by cost inflation. Historically, inflation for government goods and services has risen at a slightly faster pace than consumer price index (CPI) inflation. Higher relative government-sector inflation was driven in part by health care costs, generally attributed to labour costs and new technologies.
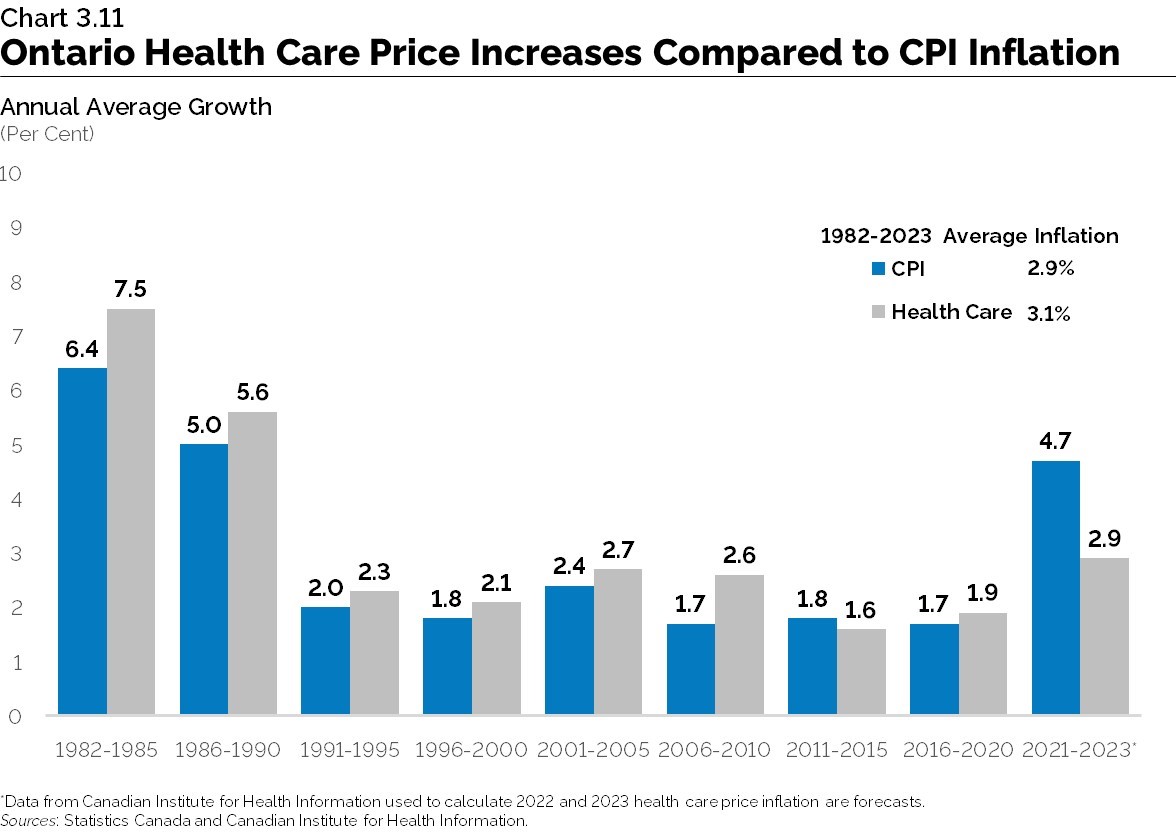
Inflation is a key driver of health care expenditures. Inflationary pressure tends to be higher in health care than in the rest of the economy because health care services are generally labour intensive and can be affected by the high costs associated with the introduction of new medical technology and drugs. Since 2011, health care inflation has risen at a rate closer to overall CPI, representing more moderate rates of heath care inflation compared to the 1982 to 2010 period in which heath care inflation significantly outpaced CPI inflation.
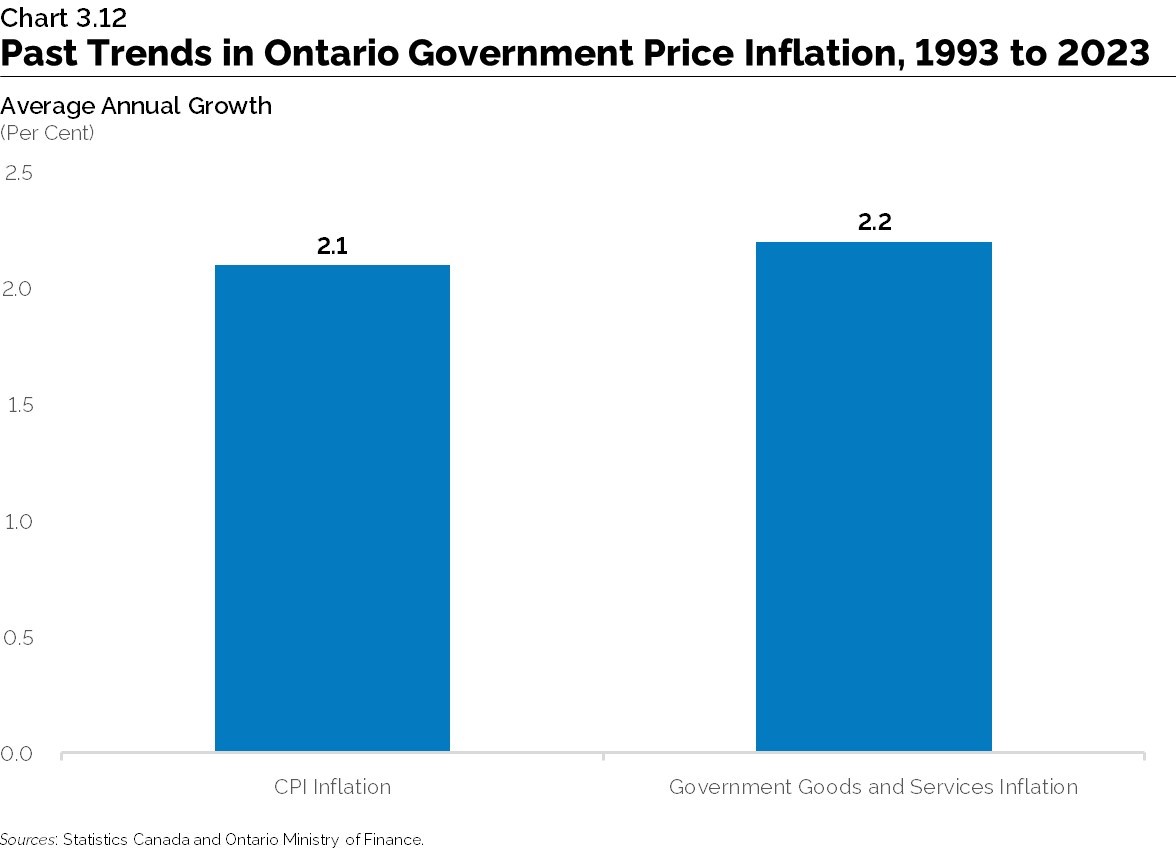
Over the projection period, average annual inflation for public services is projected to rise 2.1 per cent, modestly faster than CPI inflation of 2.0 per cent. This reflects the historical difference between CPI inflation, which averaged 2.1 per cent annually between 1993 and 2023, and inflation for government goods and services in Ontario, which averaged 2.2 per cent over the same period.
Service Enhancement
Historically, demand for public services has risen faster than overall population growth and inflation. Over the projection period, enhanced demand for public services is projected to rise in line with growth in overall real GDP per capita.
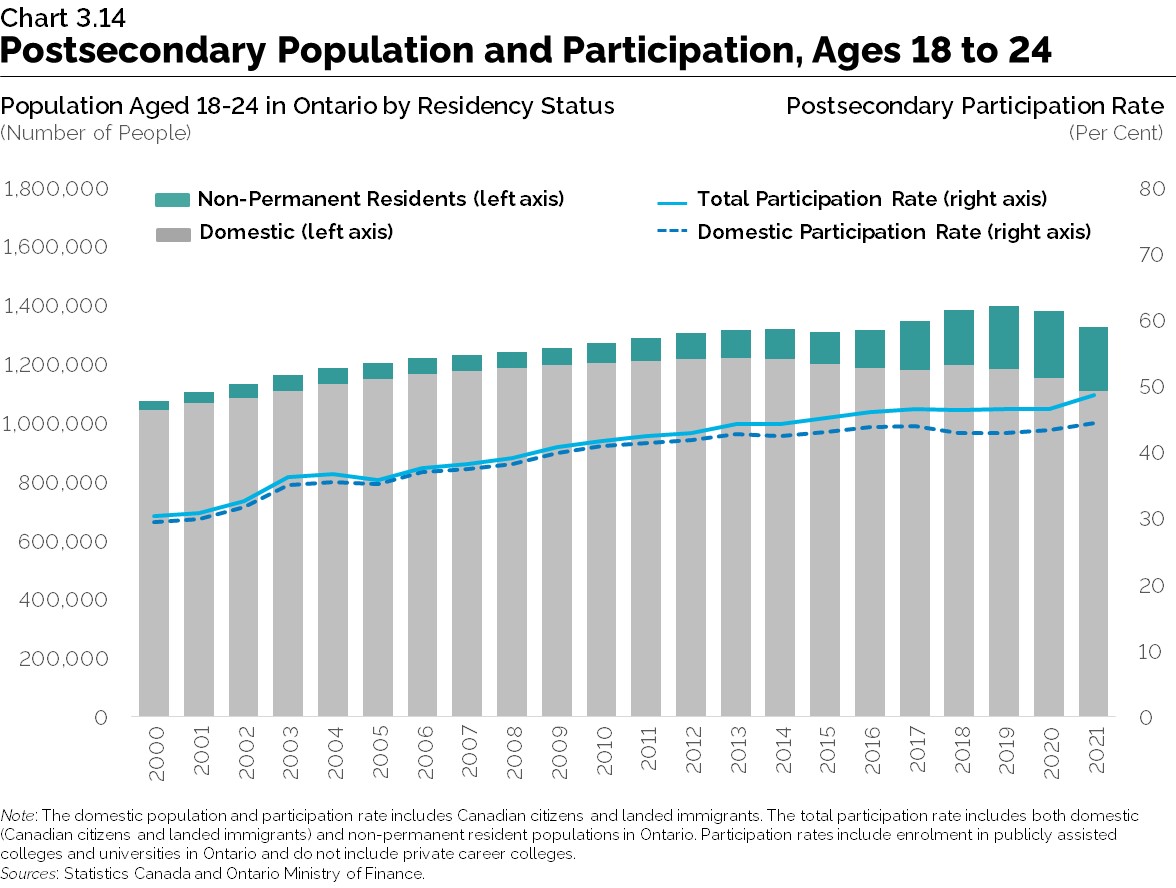
Demand for postsecondary education and training provides an example of historical service enhancement. In the postsecondary sector, demographics play a somewhat smaller role in determining enrolment than in the primary and secondary education system because participation is not universal. In Ontario, the postsecondary education participation rate among the 18 to 24 age group has increased from 30 per cent to 49 per cent from 2000 to 2021. As noted in Chapter 1: Demographic Trends and Projections, more recently, there has been a substantial increase in the non-permanent resident population among the 18 to 24 age group driven by an increase in international students. Looking ahead, postsecondary enrolment will continue to be highly influenced by a combination of demographics and demand, reflecting both economic conditions and the skills needed for future employment.
Improvements in medical technology can also lead to higher health expenditures. For instance, more specialized training and resources are required so that individuals can benefit from the new technology.
While advanced medical technology and consumer preferences can raise health care costs, they can also reduce costs through increased efficiencies and better outcomes. Medical progress, which can enhance people’s life span and quality of life through investments in research and development (R&D) towards new medical treatments, may offer the potential for long-term savings in the health care system. For example, the dissemination of evidence-based best practices in health care can reduce unnecessary treatments and testing and increase the effectiveness of services for patients.
While hospitals are core to Ontario’s health care system, it can be more cost effective and convenient for people to receive care through their family doctors, primary care teams or thier home through home and community care. As well, interprofessional primary care teams enhance the quality of patient care, improve health outcomes, and increase the efficiency of health service delivery by relieving pressures on emergency departments and walk‐in clinics. Ultimately, these factors can work towards generating efficiencies that lead to lower costs and a more sustainable health care system.

Future Fiscal Considerations
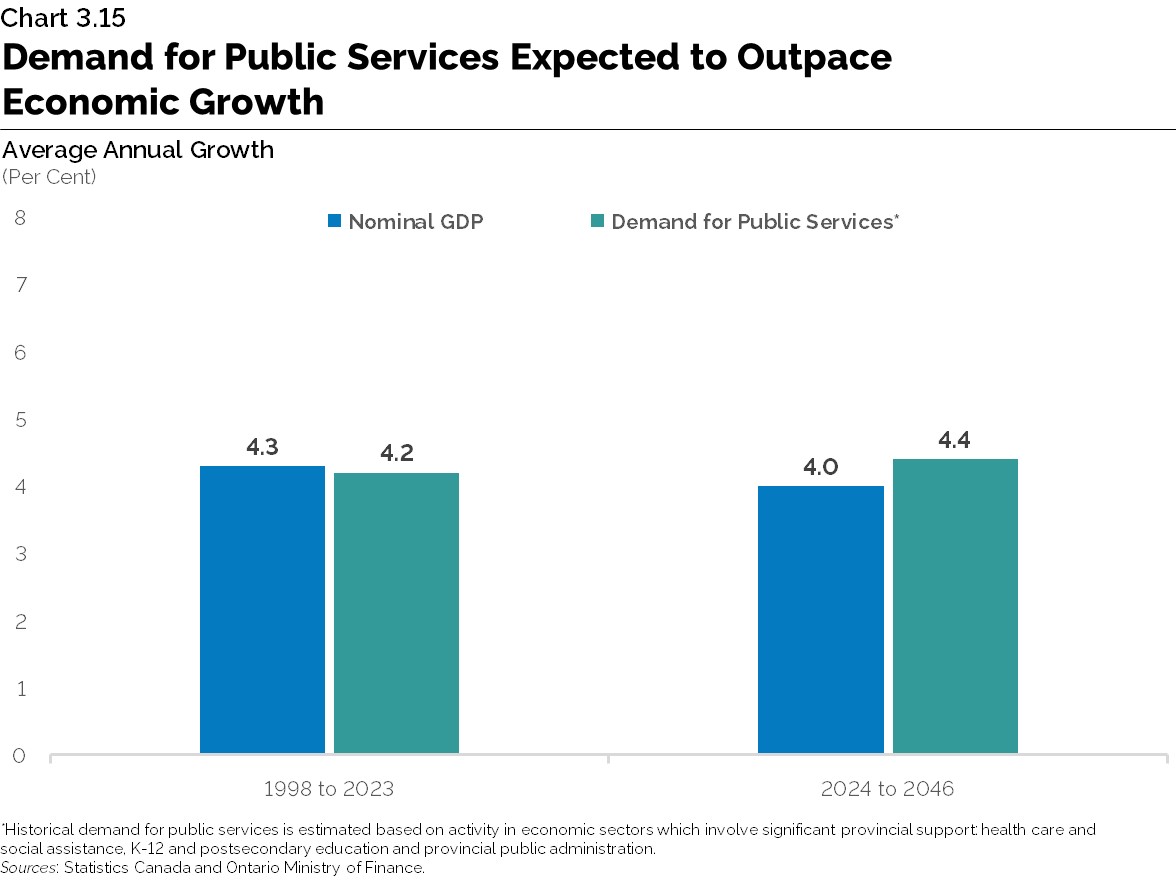
Over the long term, demand for public services is projected to rise at a faster pace than overall economic growth. As outlined earlier in this chapter, this is mainly due to the expected rise in health care demand arising from an aging population and price pressures for government services.
Change in Projected Demand for Public Services Since the 2020 Long-Term Report on the Economy
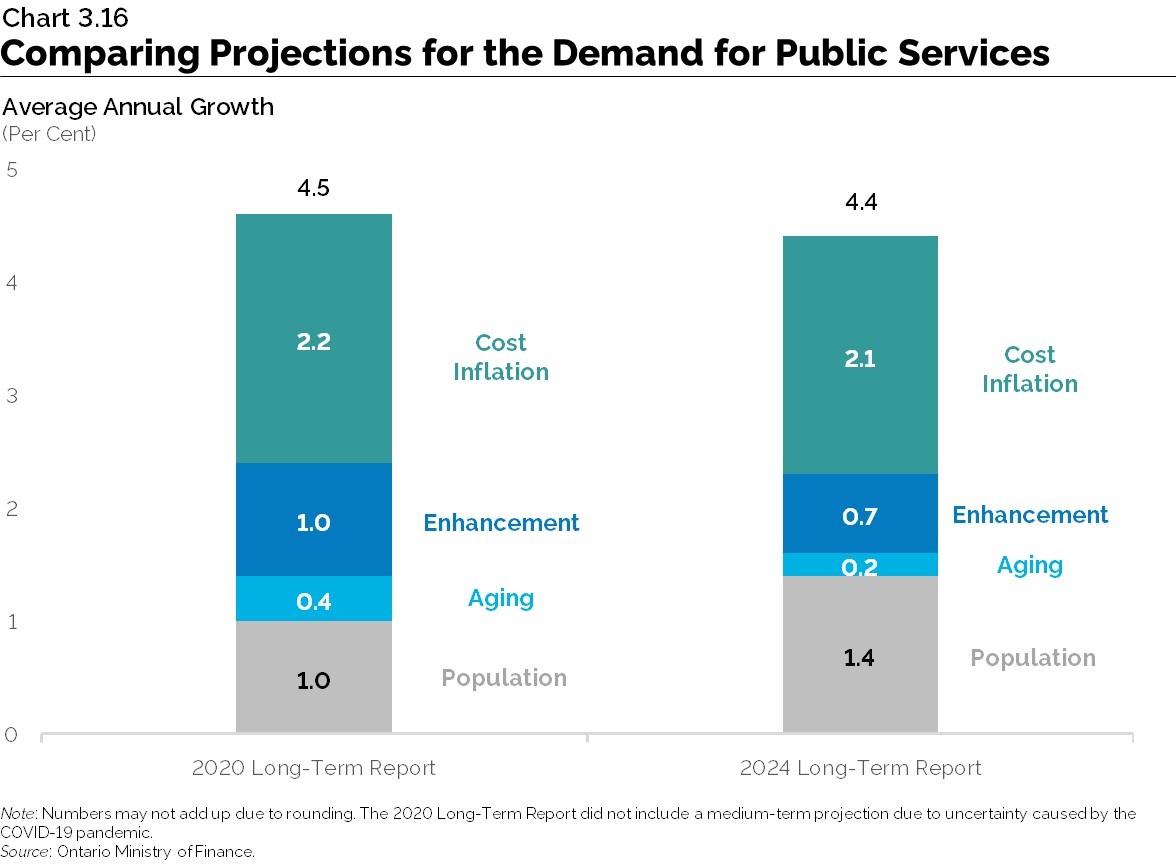
Compared to the 2020 Long-Term Report on the Economy (Long-Term Report), the projected long-run average annual growth in demand for public services has edged down to 4.4 per cent. The rate of enhancement in public services spending and the increase in demand due to population aging both declined. The overall decline in the growth rate was largely offset by a rise in demand for public services due to faster population growth.
Implications of Demographic and Economic Trends for Revenue Growth
Taxation revenues accounted for 69.7 per cent of Ontario government revenues in 2023-24, and this share is expected to remain close to 70.0 per cent in the near term. Over the longer term, taxation revenue growth is expected to slow due to the impact of an aging population on Ontario’s economic growth, tax provisions for seniors and generally lower tax rates on retirement incomes. However, favourable tax treatment of contributions to the Canada Pension Plan, workplace Registered Pension Plans and Registered Retirement Savings Plans, along with the deferred tax on income earned in those plans, results in deferred tax for individuals every year. As the population has been aging and a greater number of seniors start drawing on their retirement savings, the province has increasingly experienced a rise in income related to past savings. This trend is expected to continue and will lead to an increasing taxable income base.
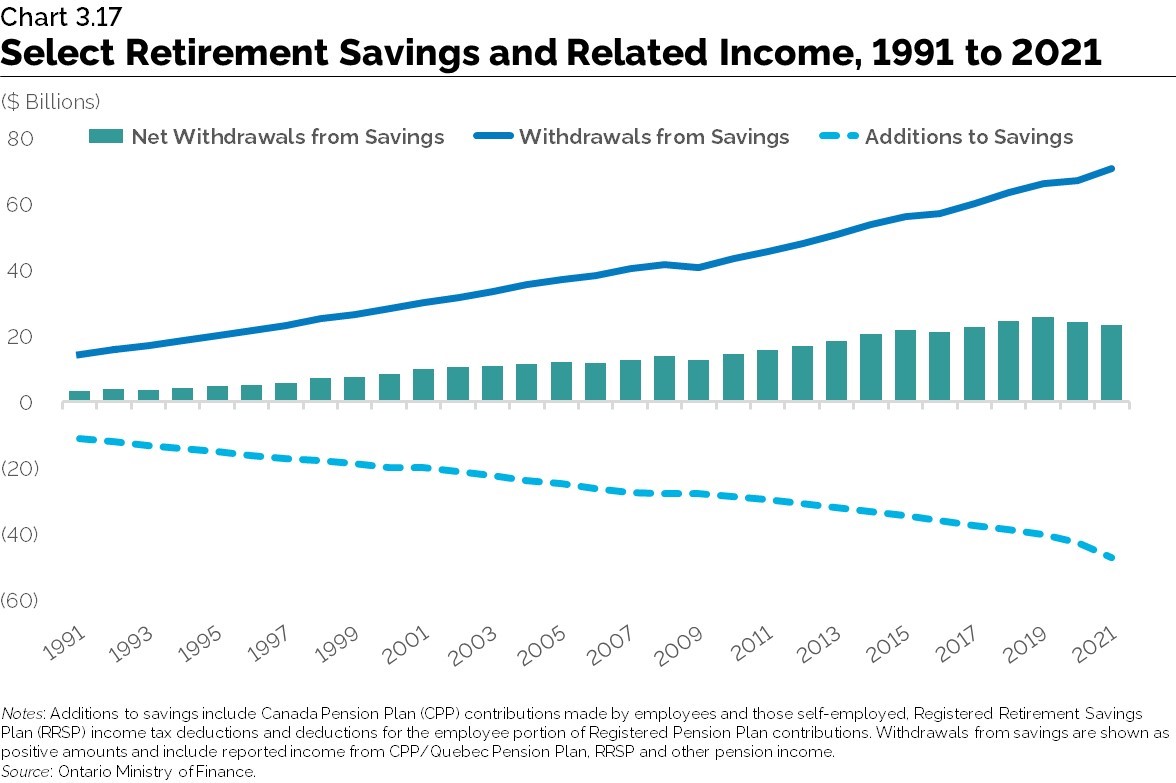
Income from retirement savings withdrawals increased at an average annual rate of 5.4 per cent over the past 30 years, outpacing overall income growth by 1.3 percentage points. This trend is expected to be more pronounced in the long term as seniors, who will make up a larger share of the population, draw on their retirement savings.
Revenue Growth Driven by Economic Growth
Over the long term, total provincial revenues are projected to grow in line with overall economic growth. Due to the slower projected pace of nominal GDP growth, revenue growth is expected to be slower than in the past.
Change in Projected Revenue Growth Since the 2020 Long-Term Report on the Economy
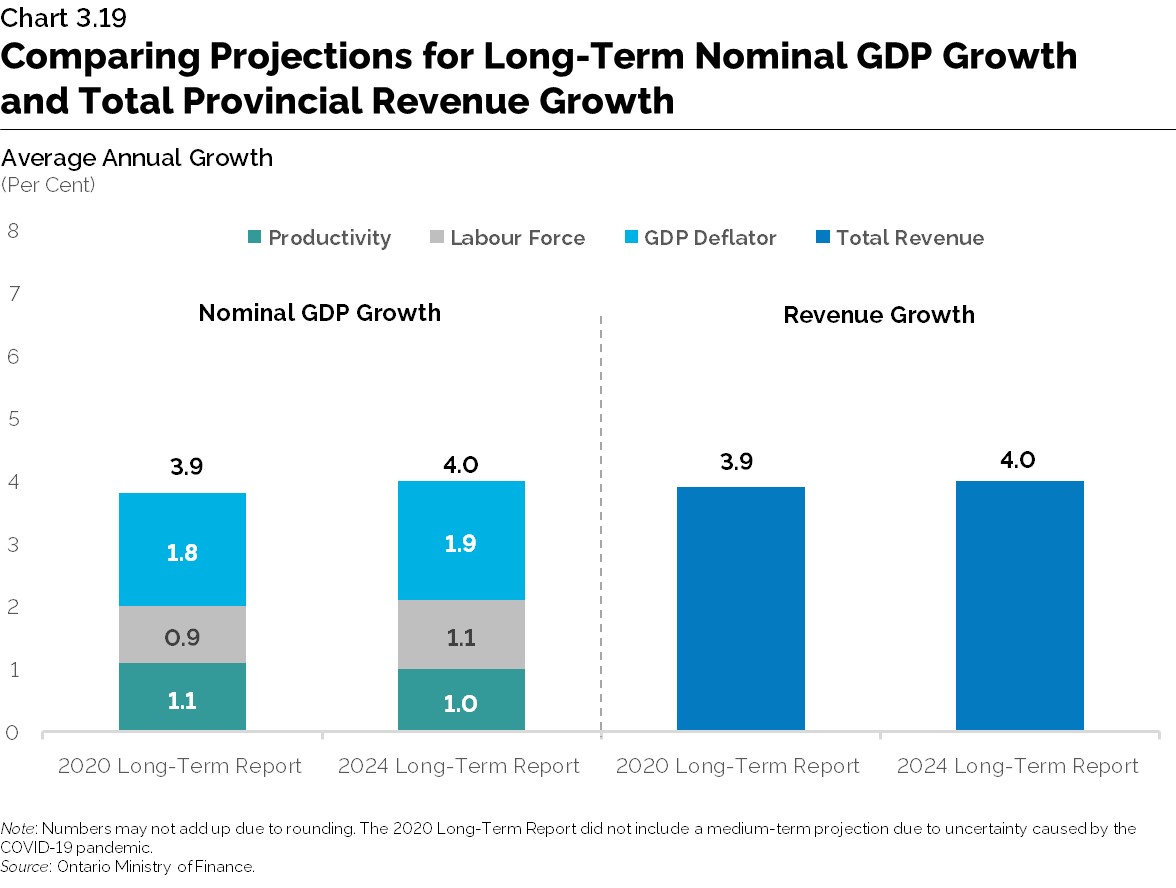
Compared to the 2020 Long-Term Report on the Economy, average annual growth in nominal GDP over the long term is projected to be slightly higher at 4.0 per cent. This stronger nominal GDP growth is mainly attributed to higher labour force growth and GDP inflation, partially offset by slightly lower productivity growth. As a result of the expected stronger nominal GDP growth, projected long-term revenue growth is expected to average 4.0 per cent annually, higher than the projection for average annual revenue growth of 3.9 per cent published in the 2020 Long-Term Report.
Fiscal Sustainability
A long-term prudent approach to fiscal management will ensure that governments have the resources available to provide effective public services that residents can rely on both now and in the future, the flexibility to manage unexpected changes that may arise, and the capacity to limit the debt burden on future generations.
Prudent fiscal management will require a sustained effort with a continued focus on financial management throughout the medium- to long-term time horizon.
Sustainability of Government Finances
Sound government finances are a cornerstone in ensuring ongoing, sustainable provision of public services over the long term.
A high debt-to-GDP ratio with no plan to reduce the debt burden will lower confidence in the province’s finances, impacting business confidence and investment. This results in a higher risk premium on borrowing and contributes to a higher cost of borrowing. Responsible fiscal management will lower the risk premium on government debt and reduce the interest on debt burden, thereby increasing resources available to fund other critical public services.
Sustainable public finances also provide increased fiscal flexibility to allow the government to respond to and mitigate adverse economic and fiscal events, such as an economic downturn, natural disaster or a pandemic. High debt levels increase the public interest burden, reducing money available to invest in public services, particularly when fiscal stimulus may be needed most.
There are also considerations with respect to intergenerational fairness. A high level of debt-funded operating spending now raises the debt burden for future generations, who may not benefit from these public expenditures.
Federal-provincial fiscal arrangements in Canada represent an important source of revenue to Ontario and impact the province’s long-term sustainability and its ability to provide public services. As the Parliamentary Budget Officer (PBO’s) long-term Fiscal Sustainability Report notes, provinces face increasing cost pressures associated with demand for services and population aging, while major federal transfers to provinces and territories as a share of GDP are projected to decline. At the same time, the report shows the federal government has long-term fiscal room in part due to declining federal transfers as a share of GDP.
Ontario’s Debt Sustainability
Fiscal sustainability, as measured by the sustainability of public debt, represents the ability of a government to manage public finances in a way that ensures resources are available to fund public services over the long term, while maintaining flexibility to address unforeseen circumstances or shocks to the economy and service debt obligations.
In the 2020 Ontario Budget, the government launched its Debt Burden Reduction Strategy which set out a plan for managing the province’s debt burden and restoring fiscal sustainability. The Ontario government reaffirmed its commitment to reducing the debt burden when it provided an updated Debt Burden Reduction Strategy in the 2024 Ontario Budget. This update included maintaining the targets the Ontario government set in the 2023 Ontario Budget. These targets are now updated annually based on the latest economic outlook to ensure Ontario is making positive progress towards reducing the debt burden.
Alternative Scenarios and Risks
There are opportunities to more sustainably manage the growth in resources required to provide public services. These include reducing program enhancement growth below historical trends and improving the productivity of service delivery.
As outlined in Chapter 2: Economic Trends and Projections, productivity growth plays a significant role in driving overall economic growth. As government revenues are driven by economic growth, future fiscal sustainability could be heavily influenced by productivity.
The base case economic projection assumes average Ontario labour productivity growth of 1.0 per cent annually over the long term. By contrast, the high productivity scenario assumes average annual labour productivity growth of 1.3 per cent and the low productivity scenario assumes growth of 0.7 per cent.
Maintaining and enhancing productivity growth is essential to generating revenues necessary to fund public services. Under a high productivity scenario, Ontario’s higher average annual labour productivity growth of 0.3 percentage points compared to the base case projection would be expected to raise annual real GDP growth to 2.4 per cent, providing important support to the projected 4.4 per cent growth in public services demand.
Chart Descriptions
Chart 3.1: Past Trends in Government Spending, Ontario, 1982 to 2023
This bar chart shows Ontario’s average annual growth in population, nominal GDP, and nominal government goods and services spending between 1982 and 2023. Population grew by 1.4 per cent, nominal GDP grew by 5.2 per cent and nominal government goods and services spending by 5.3 per cent.
Sources: Statistics Canada and Ontario Ministry of Finance.
Chart 3.2: Ontario Government Total Expense, 1981–82 to 2022–23
This line chart shows the Government of Ontario’s total expenses as a share of nominal GDP between 1981–82 and 2022–23. Total expenses as a share of nominal GDP rose from 16.5 per cent in 1981–82 to 19.0 per cent in 2022–23.
Sources: Statistics Canada and Ontario Ministry of Finance.
Chart 3.3: Ontario Government Program Spending, 1981–82 to 2022–23
This line chart shows Ontario’s per cent share of total government program spending comprised of Health, Education and Training, and Other Program Expenditures between 1981–82 and 2022–23.
In 1981-82, the health care sector constituted 27.9 per cent of total program spending, 42.7 per cent in 2012-13 and 42.1 per cent in 2022-23. The education and training sector comprised 22.8 per cent of total program spending in 1981-82, 26.5 per cent in 2012-13 and 24.8 per cent in 2022-23. Finally, other program expenditures constituted 49.3 per cent of total program spending in 1981-82, 42.7 per cent in 2012-13 and 42.1 per cent in 2022-23.
Sources: Ontario Treasury Board Secretariat and Ontario Ministry of Finance.
Chart 3.4: Ontario Government Revenues, 2022–23
This chart shows the per cent composition of total revenue in Ontario for 2022-23 by total taxation revenue (70.8 per cent), Government of Canada transfers (16.2 per cent), Income from Government Business Enterprises (3.2 per cent), and other non-tax revenue (9.8 per cent).
Note: Numbers may not add due to rounding.
Source: Ontario Ministry of Finance.
Chart 3.5: Ontario Government Revenues, 1981–82 to 2023–24
This line chart shows the per cent composition of Ontario’s total government revenue by source between 1981–82 and 2023–24. The lines represent total taxation revenue, Government of Canada transfers, income from Government Business Enterprises, and other non-tax revenue. For 2023-24, taxation revenue as a share of total government revenue was 69.7 per cent, followed by Government of Canada transfers at 17.0 per cent, income from government business enterprises at 3.6 per cent, and other non-tax revenue at 9.7 per cent.
The year 2023-24 with a “p” represents the 2024 Budget interim estimate.
Note: Revenues have been restated to reflect reporting changes and reclassifications.
Source: Ontario Ministry of Finance.
Chart 3.6: Ontario Government Fiscal Balance, 1981–82 to 2023–24
The bar and line charts show Ontario’s fiscal balance as a percent of GDP (represented by left-hand side axis) and fiscal balance in billions of dollars (represented by right-hand side axis) between 1981–82 and 2023–24.
The year 2023–24 with a “p” represents 2024 Budget interim estimate.
Sources: Statistics Canada and Ontario Ministry of Finance.
Chart 3.7: Ontario Government Net Debt, 1981–82 to 2023–24
This line graph shows Ontario’s net debt as a share of nominal GDP between 1981–82 and 2023–24. The ratio rose from 10.4 per cent of GDP in 1981–82 to a peak of 42.6 per cent in 2020–21 before declining to 38.2 per cent of GDP in 2022–23. It is projected to further decline to 37.9 per cent in 2023–24 based on the 2024 Budget’s interim estimate.
Sources: Statistics Canada and Ontario Ministry of Finance.
Chart 3.8: Low Interest on Debt Costs as a Share of Revenues Supported by Low Interest Rates Since 2008-09
This line chart shows Ontario’s net-debt-to-GDP ratio on left-hand side axis and Ontario’s interest on debt-to-total revenue ratio on the right-hand axis, between 1990–91 and 2023–24. The net debt-to-GDP ratio rose from 13.4 per cent in 1990–91 to 42.6 per cent by 2020–21 and is expected to decline to 37.9 per cent by 2023–24 based on the 2024 Budget’s interim estimate. The interest on debt-to-total revenue ratio rose from 7.7 per cent in 1990–91 to 15.5 per cent in 1999-2000 before declining. It is expected to be 6.3 per cent in 2023-24 based on the 2024 Budget’s interim estimate.
Sources: Statistics Canada and Ontario Ministry of Finance.
Chart 3.9: Demand for Public Services Expected to Rise
This bar chart shows Ontario’s average annual growth of provincial public services demand between 1998 and 2023 on the left and projected growth between 2024 and 2046 on the right, including the components of the long-term projection. Between 1998 and 2023, average annual growth in provincial public services demand was 4.2 per cent. The long-term projection shows that between 2024 and 2046, average annual growth in provincial public services demand is expected to be 4.4 per cent, including contributions from population growth of 1.4 per cent, aging of 0.2 per cent, enhancement of 0.7 per cent and cost inflation of 2.1 per cent.
Notes: Historical demand for public services is estimated based on activity in economic sectors which involves significant provincial support: health care and social assistance, K-12 and postsecondary education and provincial public administration.
Sources: Statistics Canada and Ontario Ministry of Finance.
Chart 3.10: School-Age Population in Ontario
This line chart shows the number of Ontario’s school-age children aged 4 to 13 years and aged 14 to 17 years for the period 1971 to 2046. The figures prior to 2024 are historical, and they are projections between 2024 and 2046. In 2023, there were 1.6 million children aged 4 to 13 and 674,000 children aged 14 to 17. The 4 to 13 age group is projected to reach 2.2 million by 2046, while the 14 to 17 age group is projected to increase to 884,000 by 2046.
Sources: Statistics Canada for 1971-2023 and Ontario Ministry of Finance projections.
Chart 3.11: Ontario Health Care Price Increases Compared to CPI Inflation
This bar chart shows consumer price index (CPI) inflation (left bar) and health care inflation (right bar) at various intervals during the 1982 to 2023 period. The text box shows average CPI and health care inflation over the entire 1982 to 2023 period. Over 1982 to 2023, the average CPI inflation was 2.9 per cent and health care inflation was 3.1 per cent.
*Note: Data from the Canadian Institute for Health Information used to calculate 2022 and 2023 health care price inflation are forecasts.
Sources: Statistics Canada and Canadian Institute for Health Information.
Chart 3.12: Past Trends in Ontario Government Price Inflation, 1993 to 2023
This bar chart shows consumer price index (CPI) inflation and government goods and services inflation calculated as average annual growth for the period 1993 to 2023. CPI inflation was 2.1 per cent and government goods and services inflation was 2.2 per cent.
Sources: Statistics Canada and Ontario Ministry of Finance.
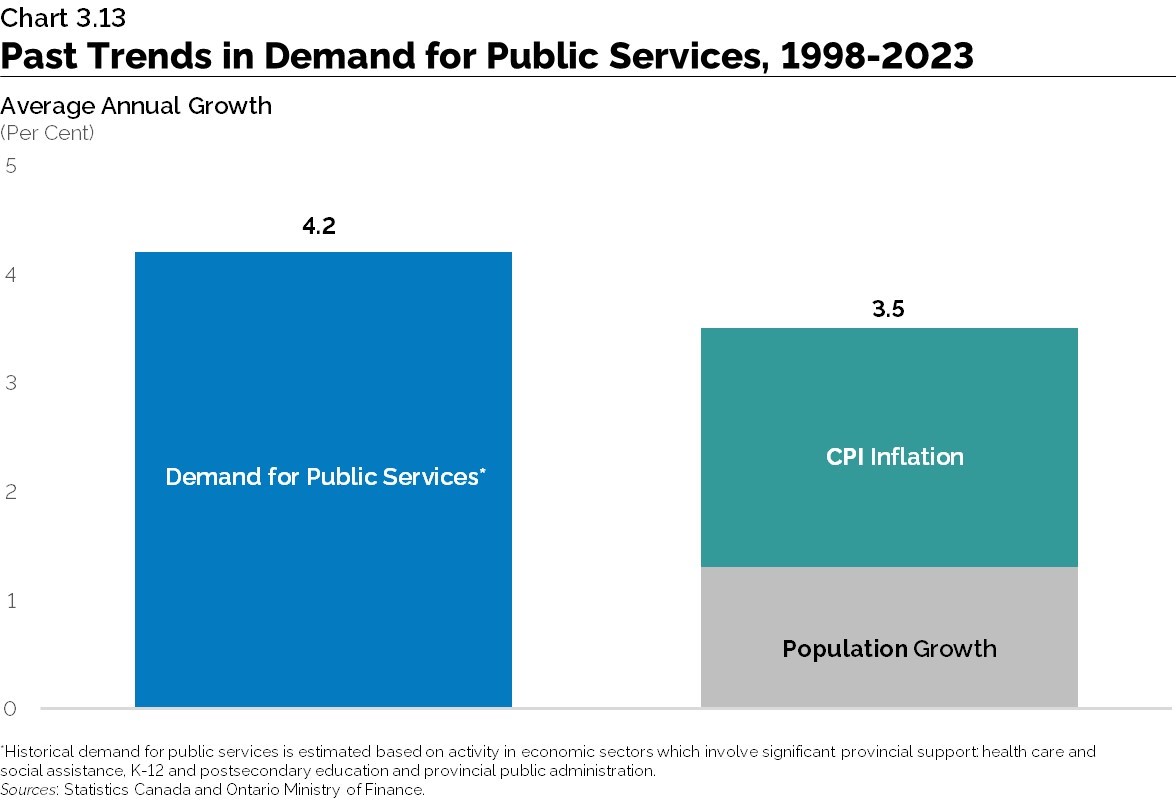
Chart 3.13: Past Trends in Demand for Public Services, 1998-2023
This bar chart shows Ontario’s average annual growth of provincial public services demand on the left and the sum of population growth and CPI inflation on the right between 1998 and 2023. Between 1998 and 2023, average annual growth in provincial public services demand was 4.2 per cent. Between 1998 and 2023, the sum of Ontario’s average annual population growth and CPI inflation was 3.5 per cent, including population growth of 1.3 per cent and CPI inflation of 2.2 per cent.
Note: Historical demand for public services is estimated based on activity in economic sectors which involve significant provincial support: health care and social assistance, K-12 and postsecondary education and provincial public administration.
Sources: Statistics Canada and Ontario Ministry of Finance.
Chart 3.14: Postsecondary Population and Participation, Ages 18 to 24
The chart shows the total number of domestic and non-permanent residents aged 18-24 in Ontario in the stacked bars (left axis) and the total and domestic postsecondary participation rate in the lines (right axis). The domestic population increased from 1,043,003 in 2000 to 1,108,667 in 2021. The non-permanent resident population increased from 31,471 in 2000 to 217,903 in 2021. The total postsecondary participation rate increased from 30 per cent in 2000 to 49 per cent in 2021. The domestic postsecondary participation rate increased from 29 per cent in 2000 to 44 per cent in 2021.
Note: The domestic population and participation rate includes Canadian citizens and landed immigrants. The total participation rate includes both domestic (Canadian citizens and landed immigrants) and non-permanent resident populations in Ontario.Participation rates include enrolment in publicly assisted colleges and universities in Ontario and do not include private career colleges.
Sources: Ministry of Finance and Statistics Canada.
Chart 3.15: Demand for Public Services Expected to Outpace Economic Growth
This bar chart shows average annual growth in Ontario nominal GDP and growth in provincial public services demand for two time periods: 1998 to 2023 on the left and 2024 to 2046 on the right. Between 1998 and 2023, average annual growth in nominal GDP was 4.3 per cent and average annual growth in provincial public services demand was 4.2 per cent. Between 2024 and 2046, average annual growth in nominal GDP is expected to be 4.0 per cent and average annual growth in provincial public services demand is expected to be 4.4 per cent.
Note: Historical demand for public services is estimated based on activity in economic sectors which involves significant provincial support: health care and social assistance, K-12 and postsecondary education and provincial public administration.
Sources: Statistics Canada and Ontario Ministry of Finance.
Chart 3.16: Comparing Projections for the Demand for Public Services
This bar chart shows the long-run projected average annual growth in the demand for provincial public services as presented in the 2020 Long-Term Report and the 2024 Long-Term Report, including the contributors to growth. In the 2020 Long-Term Report the long-run average annual growth in provincial public services demand was expected to be 4.5 per cent, including contributions from population growth of 1.0 per cent, aging of 0.4 per cent, enhancement of 1.0 per cent and cost inflation of 2.2 per cent. In the 2024 Long-Term Report, the long-run average annual growth in provincial public services demand is expected to be 4.4 per cent, including contributions from population growth of 1.4 per cent, aging of 0.2 per cent, enhancement of 0.7 per cent and cost inflation of 2.1 per cent.
Note: Numbers may not add up due to rounding. The 2020 Long-Term Report did not include a medium-term projection due to uncertainty caused by the COVID-19 pandemic.
Source: Ontario Ministry of Finance.
Chart 3.17: Select Retirement Savings and Related Income, 1991 to 2021
This line and bar chart for Ontario shows additions to savings, withdrawals from savings, and the net withdrawals from savings between 1991 and 2021. Additions to savings include Canada Pension Plan (CPP) contributions made by employees and those self-employed, Registered Retirement Savings Plan (RRSP) income tax deductions and deductions for the employee portion of Registered Pension Plan contributions. Withdrawals from savings are shown as positive amounts and include reported income from CPP/Quebec Pension Plan, RRSP and other pension income. The chart shows that withdrawals from savings have been outpacing additions to savings, with a gradual increase in the net amounts.
Source: Ontario Ministry of Finance.
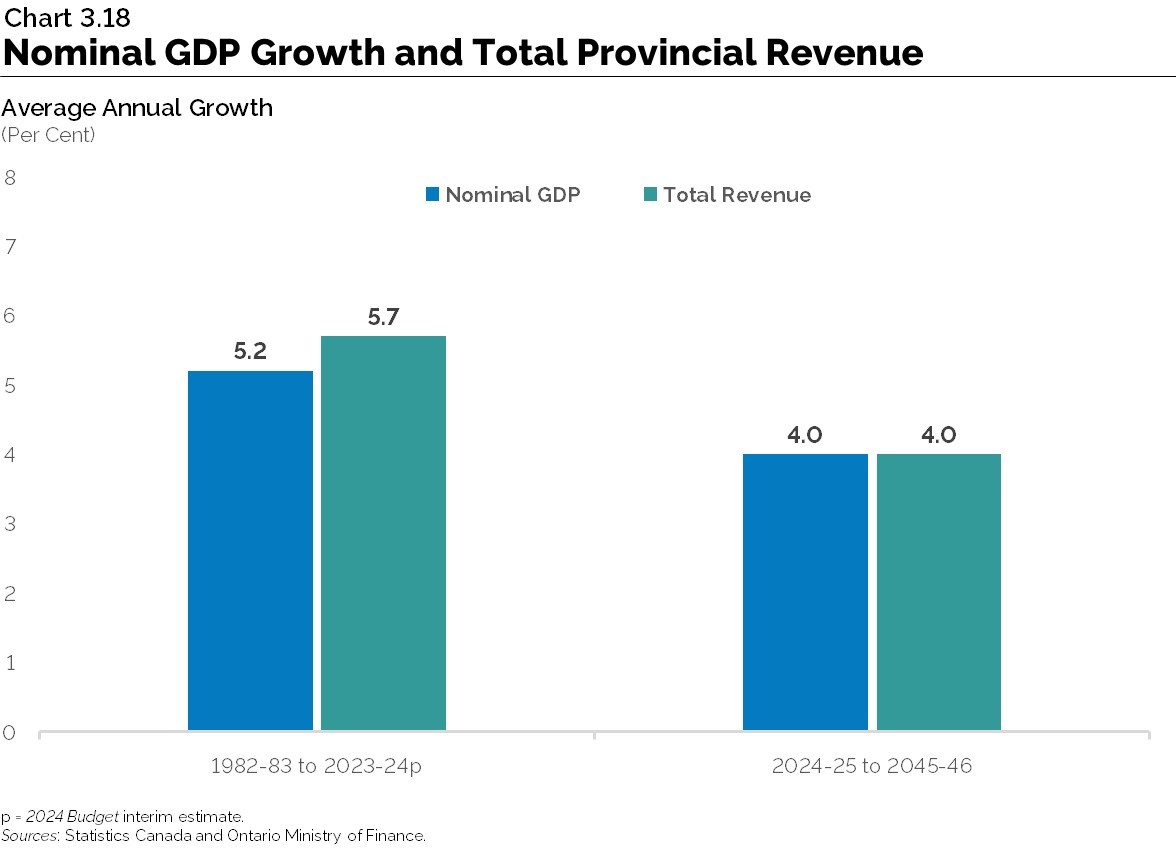
Chart 3.18: Nominal GDP Growth and Total Provincial Revenue
This bar chart shows Ontario’s average annual growth of nominal GDP and total provincial revenue for 1982–83 to 2023–24 and 2024–25 to 2045–46. Between 1982–83 and 2023–24, nominal GDP grew by 5.2 per cent and total revenue grew by 5.7 per cent. Between 2024–25 and 2045–46, both nominal GDP and total revenue are projected to grow at 4.0 per cent respectively.
The year 2023-24 with a “p” represents the 2024 Budget interim estimate.
Sources: Statistics Canada and Ontario Ministry of Finance.
Chart 3.19: Comparing Projections for Long-Term Nominal GDP Growth and Total Provincial Revenue Growth
This bar and stacked bar chart compares projected average annual nominal GDP growth, components of nominal GDP growth and revenue growth, for Ontario’s 2020 and 2024 Long-Term Reports.
For the 2020 Long-Term Report, projected average annual nominal GDP growth was 3.9 per cent, consisting of 1.1 per cent productivity growth, 0.9 per cent labour force growth, and 1.8 per cent GDP inflation, while projected average annual revenue growth was 3.9 per cent.
In the 2024 Long-Term Report, projected average annual nominal GDP growth is 4.0 per cent, consisting of 1.0 per cent productivity growth, 1.1 per cent labour force growth, and 1.9 per cent GDP inflation, while projected average annual revenue growth is 4.0 per cent.
Note: Numbers may not add up due to rounding. The 2020 Long-Term Report did not include a medium-term projection due to uncertainty caused by the COVID-19 pandemic.
Sources: Statistics Canada and Ontario Ministry of Finance.
Footnotes
- footnote[1] Back to paragraph “He Tirohanga Mokopuna 2021: The Treasury’s combined Statement on the Long-term Fiscal Position and Long-term Insights Briefing”, The New Zealand Treasury, New Zealand Government, 2021.
- footnote[2] Back to paragraph Australia’s Aging Population: Understanding the fiscal impacts over the next decade”, Commonwealth of Australia, Report No. 02/2019.