Chapter 2: Economic Trends and Projections 2024
Introduction
This chapter outlines a long-range projection of Ontario’s economy between 2024 and 2046. The projection is based on a set of external economic assumptions, as well as demographic trends outlined in Chapter 1: Demographic Trends and Projections. Between 2024 and 2046, Ontario real gross domestic product (GDP) is expected to grow by 2.1 per cent on average per year.
Compared with Ontario’s 2020 Long-Term Report on the Economy, real GDP growth is expected to be on average 0.1 percentage points higher. However, Ontario’s economy is projected to grow at a slower pace over the long term when compared to its historical trend. This deceleration reflects an anticipated slowdown in labour force growth driven in part by an aging population. Immigration will continue to support increases in Ontario’s working-age population over the outlook and help offset some of this slowdown. Over the outlook, productivity growth is assumed to be slightly slower compared to its historical trend, a challenge which can be met by further enhancing the productive capacity of the labour force through innovation, skills training and increased business investment.
| 1982-2023 | 2024-2046 | |
|---|---|---|
| Nominal GDP | 5.2 | 4.0 |
| Real GDP | 2.4 | 2.1 |
| Consumer Price Index | 2.9 | 2.0 |
| Labour Productivity | 1.1 | 1.0 |
| Labour Force | 1.4 | 1.1 |
Note: Historical average for labour productivity growth reflects the 1998 to 2022 period.
Sources: Statistics Canada and Ontario Ministry of Finance.
Ontario’s Post-Pandemic Economic Recovery
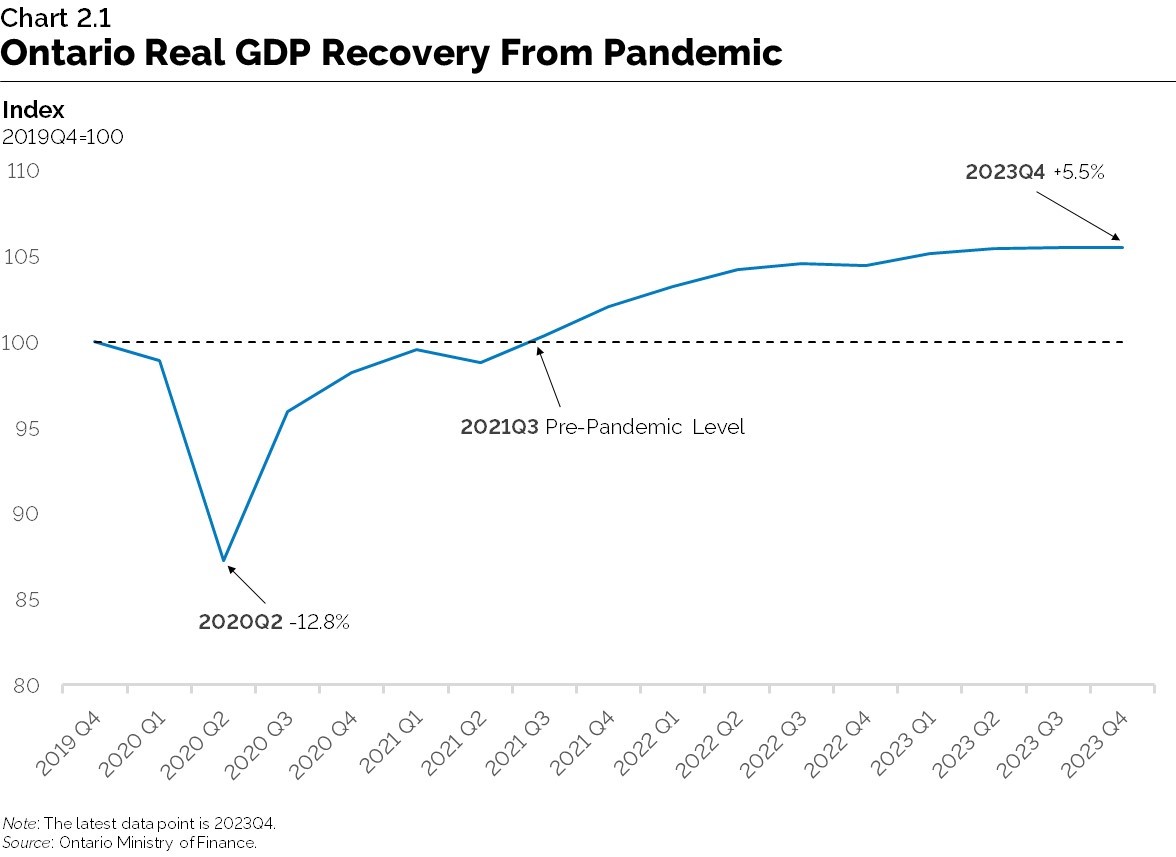
The COVID-19 pandemic resulted in one of the most significant economic downturns in modern history, however the recovery has been robust. During the onset of the pandemic, Ontario’s real GDP contracted by 12.8 per cent by the second quarter of 2020 relative to the pre-pandemic level in the fourth quarter of 2019. Virtually all industries were significantly impacted by the pandemic, with sharp declines in real GDP experienced in accommodation and food services (-60 per cent), arts, entertainment and recreation (-56 per cent) and transportation and warehousing (-38 per cent). Ontario real GDP returned to its pre-pandemic level by the third quarter of 2021 and by the fourth quarter of 2023 real GDP was 5.5 per cent above the pre-pandemic level.

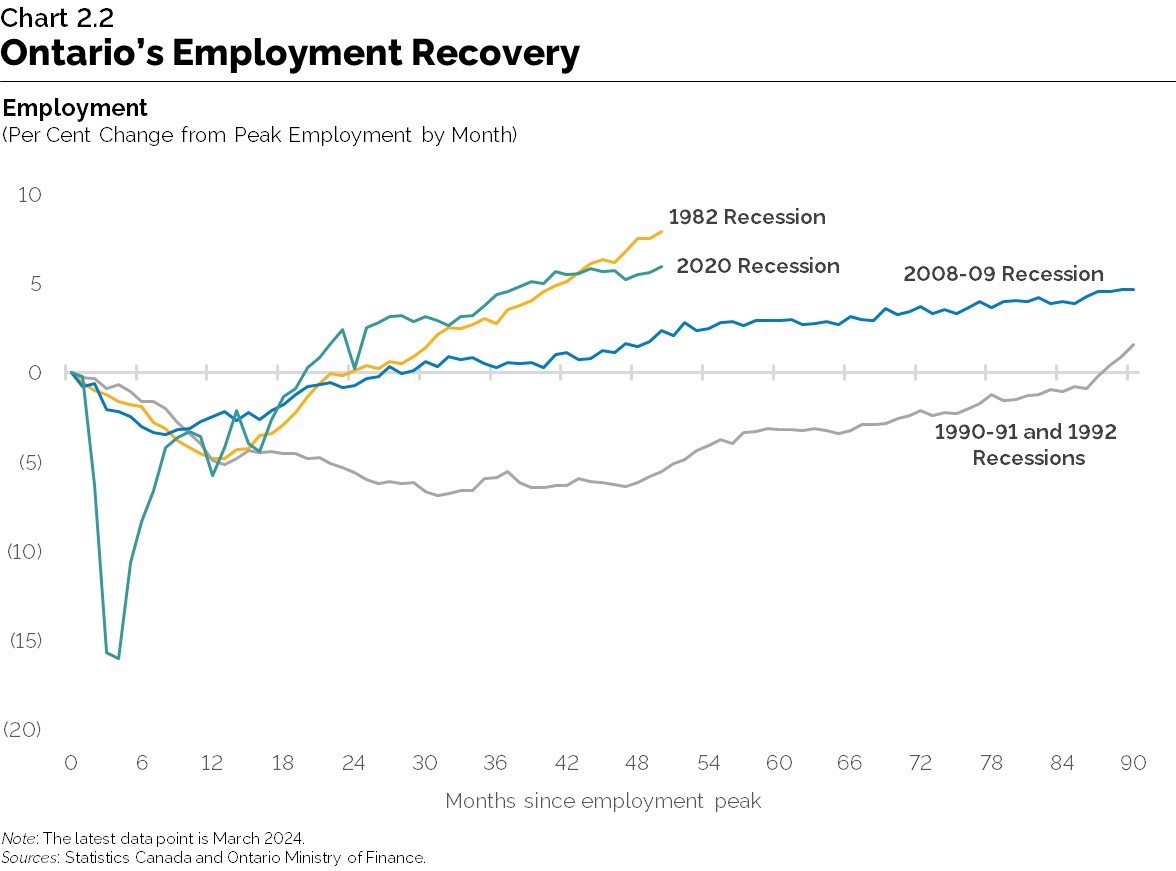
During the initial months of the pandemic, Ontario also experienced a sharp drop in employment (-16 per cent), surpassing the severity and speed of all prior modern economic downturns. However, the recovery in employment was also faster and stronger than any previous recession, exceeding its pre-pandemic level, by September 2021.
Despite the sudden and significant economic impact of the pandemic, the long-term projection presented in this chapter begins with many Ontario economic indicators well above their pre-pandemic level, including GDP and employment.
External Economic Environment
Ontario is part of an integrated global economy, strongly influenced by growth in other regions, commodity prices, the Canadian dollar exchange rate and interest rates. Assumptions about these key external factors shape the backdrop of this long-term projection and are broadly aligned with private-sector forecasts.
| 1982-2023 | 2024-2046 | |
|---|---|---|
| Rest-of-Canada Real GDP (Per Cent Change) | 2.1 | 2.0 |
| U.S. Real GDP (Per Cent Change) | 2.7 | 2.0 |
| Canadian Dollar (Cents US) | 79.7 | 78.9 |
| 90-Day Treasury Bill Rate (Per Cent) | 4.6 | 2.8 |
| 10-Year Government of Canada Government Bond Rate (Per Cent) | 5.7 | 3.5 |
| U.S. 90-day Treasury Bill Rate (Per Cent) | 3.7 | 2.8 |
| 10-Year U.S. Government Bond Rate (Per Cent) | 5.4 | 3.5 |
| West Texas Intermediate (WTI) Oil Price (2023 US$ per Barrel) | 65.9 | 77.5 |
Note: Historical average for West Texas Intermediate Oil Price reflects the 1986 to 2023 period.
Sources: Statistics Canada, U.S. Bureau of Economic Analysis, Bank of Canada, U.S. Energy Information Administration, Federal Reserve and Ontario Ministry of Finance.
Global Economy
Following a strong rebound from the pandemic, global economic growth is projected to moderate. Supply chain disruptions, ongoing geopolitical tensions and excess demand have contributed to record high inflation and prompted many central banks to raise key interest rates. The impact of tighter credit conditions and restrictive monetary policy are expected to weigh on global demand over the near term.
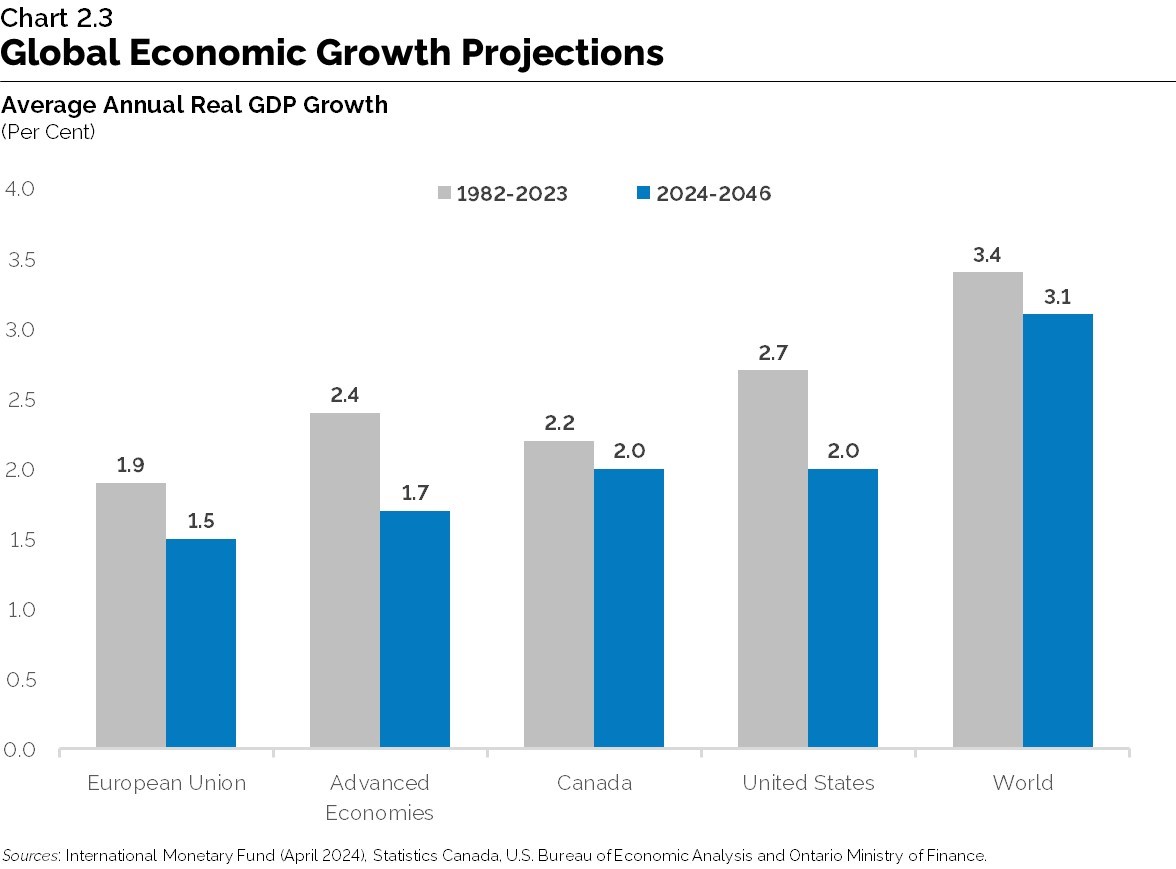
Overall, global real GDP is projected to advance at an average annual pace of 3.1 per cent over the long term, down from its historical average of 3.4 per cent. Over the long-term projection, labour force growth is expected to slow in many regions due to an aging population, leading to a deceleration in global economic growth.
United States
U.S. economic growth is a key driver of Ontario’s exports and overall economy. The United States is Ontario’s largest trading partner, accounting for nearly 82 per cent of merchandise goods exports in 2023. The long-term projection assumes the U.S. economy will grow at an average annual pace of 2.0 per cent, slower than its historical average of 2.7 per cent.
According to the U.S. Congressional Budget Office (CBO), slowing population growth and an aging workforce will weigh on the labour force and potential real GDP growth over the long term. However, increases in educational attainment and life expectancy of the working-age population are expected to partially offset the slowdown.
Commodity Prices
Global commodity markets have experienced significant volatility in recent years. After declining sharply during the COVID-19 pandemic, global crude oil prices rebounded, in part due to rising demand, tighter supply conditions and Russia’s invasion of Ukraine. As a net importer of commodities, higher oil prices increase costs for businesses and consumers and generally weaken Ontario’s terms of trade.
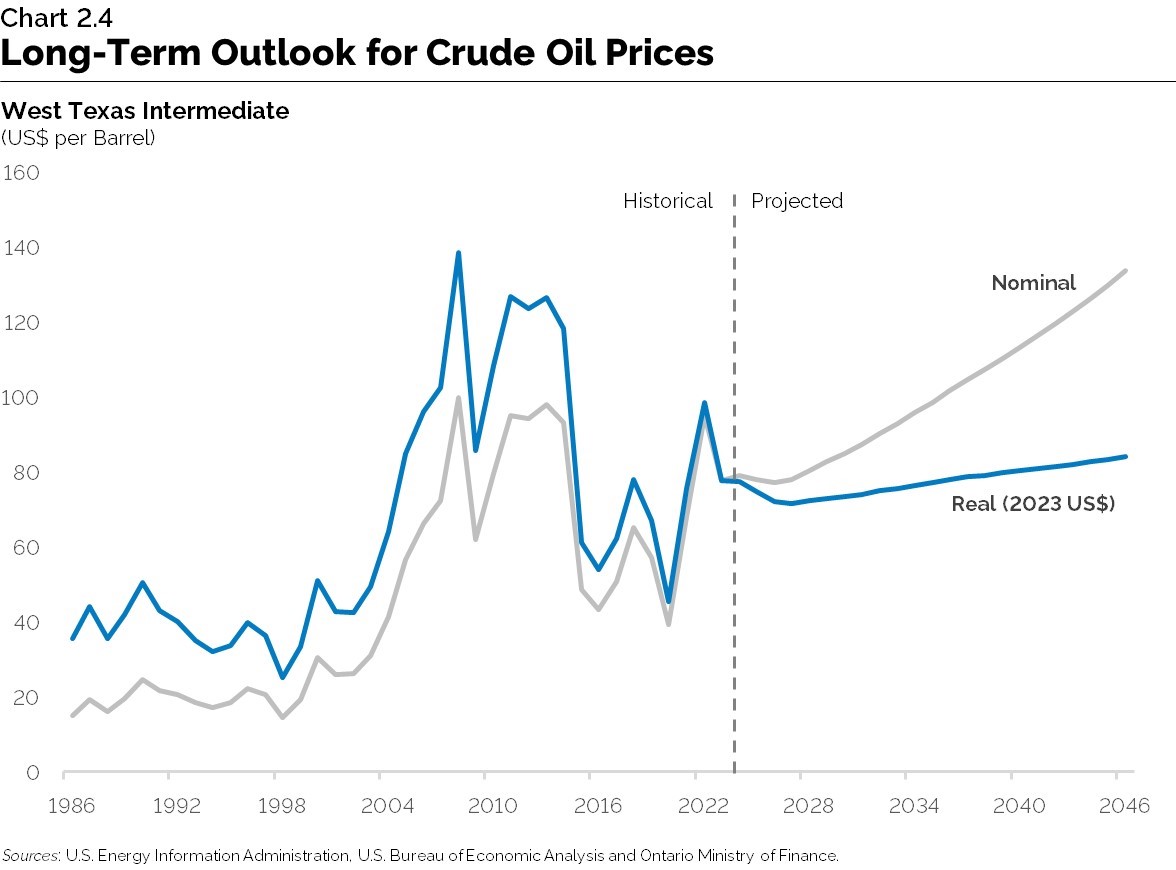
Over the long term, oil prices are expected to rise, supported by continued global demand, especially in emerging markets such as China and India. This projection assumes West Texas Intermediate (WTI) crude oil prices will reach $134 US per barrel by 2046. In real terms, prices are expected to rise modestly, approaching $84 US per barrel by the end of the projection period. There is considerable uncertainty around this projection related to both ongoing and unexpected geopolitical events and the transition toward cleaner energy technologies which could significantly impact oil markets in the future.
Interest Rates
Global supply disruptions resulting from the COVID-19 pandemic, ongoing geopolitical tensions and excess demand led to high inflation, both domestically and abroad. In response, the Bank of Canada, along with many other central banks, raised key interest rates to restore price stability. The Bank of Canada raised its policy interest rate from 0.25 per cent in March 2022 to 5.0 per cent in July 2023.
As inflation moderates, the policy interest rate is projected to fall to levels consistent with the neutral rate of interest - that is, the rate needed to keep economic activity at its longer-run potential and inflation at its target. The Bank’s estimate of the neutral rate lies between 2.25 and 3.25 per cent. This projection assumes the three-month Government of Canada treasury bill rate will settle at 2.8 per cent, on average. Longer-term rates, like the 10-year Government of Canada bond rate, are expected to average 3.5 per cent over the projection period.
Canadian Dollar
The Canadian/U.S. dollar exchange rate is particularly important for Ontario as the United States is by far Ontario’s largest trading partner. The Canadian dollar is expected to rise modestly over the long-term projection, consistent with the steady increase in commodity prices. Canada is a net exporter of oil, therefore, a gradual rise in oil prices is expected to boost economic growth, especially in oil-producing provinces, and lead to a gradual appreciation in the dollar over time.
Rest of Canada
The rest of Canada is expected to remain an important destination for Ontario’s exports. Economic growth in the rest of Canada is projected to average 2.0 per cent annually over the long term, supported by a modest rise in commodity prices and stable economic growth in the United States.

Ontario’s Potential Economic Output
Potential economic output is the speed at which the economy can grow over the long term without increasing the rate of inflation. Two key components of long-term potential growth are the labour supply and the efficiency with which workers use capital to produce output, namely, productivity.
Labour Force
Labour force growth depends on growth in the working-age population and the participation rate, which is the percentage of the working-age population either employed or seeking employment. Growth in Ontario’s working-age population is based on the demographic projections presented in Chapter 1: Demographic Trends and Projections.
Despite the impact of strong immigration-led population growth, Ontario’s labour force growth is projected to slow over the outlook. The moderation in growth is due to Ontario’s labour force participation rate, which is projected to ease from its historical average of 66.9 per cent to 63.1 per cent over the projection period. The following demographic trends are expected to impact labour markets over the long term.
Aging Workforce
Labour force participation among older workers (aged 55 and over) has gradually risen over the past few decades. Notably, participation rates among those in the pre-retirement age cohort of 55 to 64 improved significantly since the late 1990s. The increase in labour market engagement is owed to several factors including rising rates of educational attainment, improved health outcomes and greater employment opportunities. Furthermore, the elimination of the mandatory retirement age has also contributed to the rise in participation rates for those 65 and over.
The aging of Ontario’s population is expected to weigh on labour supply over the projection period. Older workers transitioning into retirement age have significantly lower participation rates compared to other working-age cohorts, which is expected to put downward pressure on the overall participation rate.
Immigration
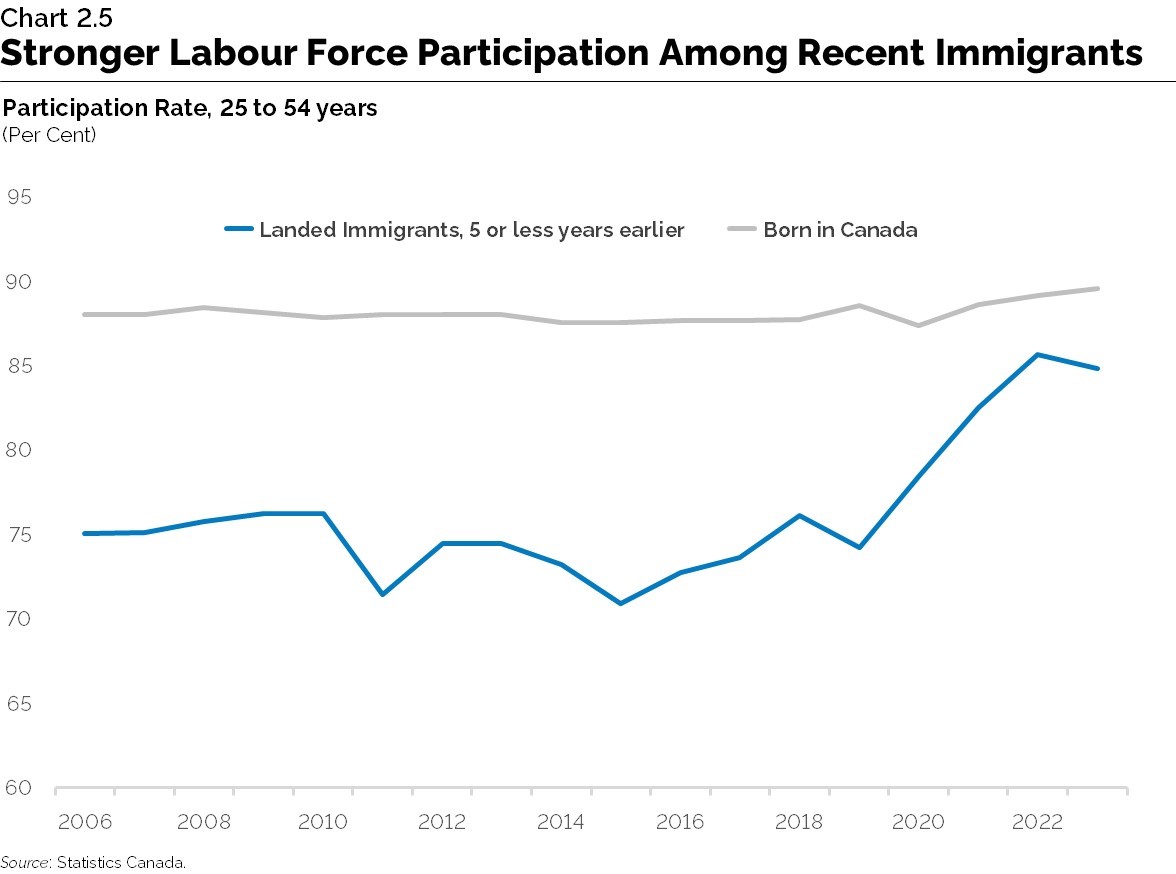
Immigration is a key driver of Ontario’s labour force growth, accounting for more than half of the increase in the province’s workforce between 2006 and 2023. During that time, the labour force participation gap between newer immigrants and non-immigrants has gradually narrowed, due in part to policies which have helped attract skilled and educated workers to the province. Over the long term, immigration will continue to drive growth in Ontario’s working-age population and help to partially offset the drag of an aging population on the labour force, placing Ontario in a more advantageous demographic position than many other advanced economies.
Labour Force Participation Rates
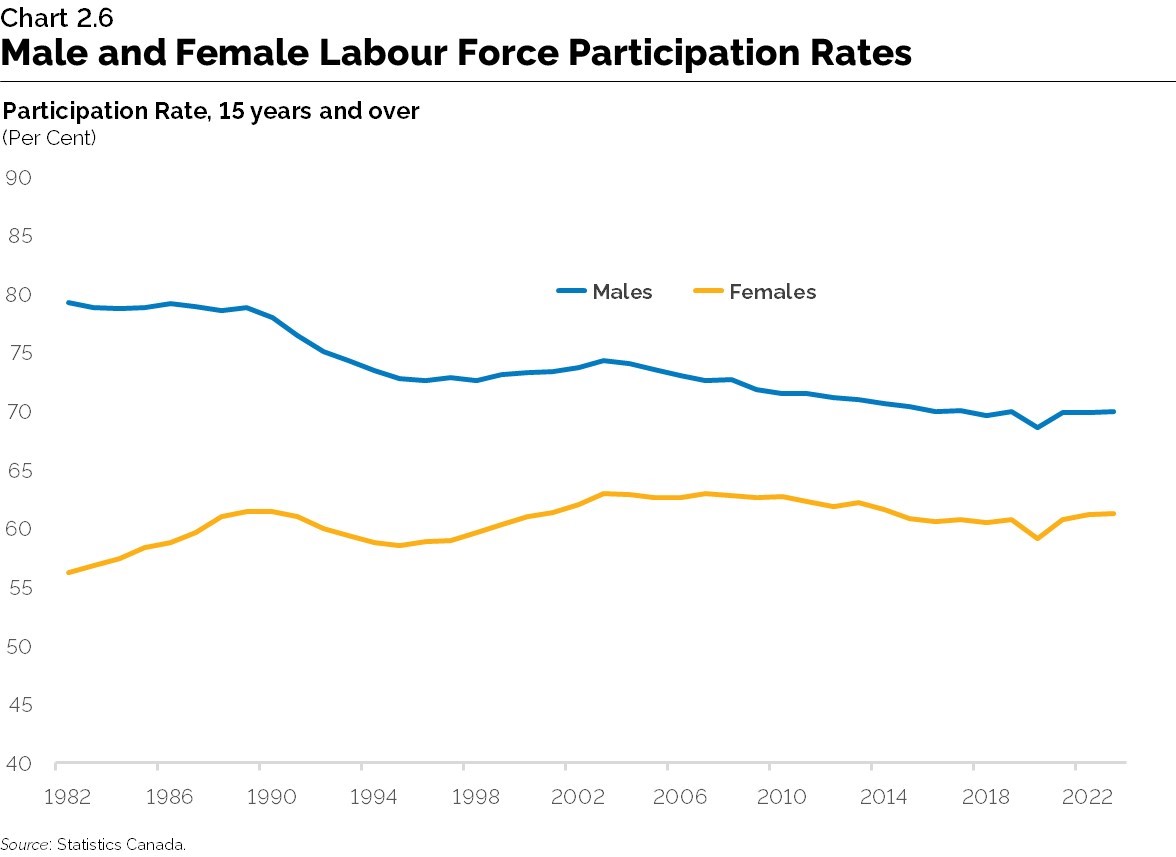
Over the past few decades, labour force engagement among females has risen significantly, which has led to the gap between male and female participation rates to narrow from 23.1 percentage points in 1982 to 8.8 percentage points in 2023. The increase in labour force participation is due to several factors, including rising levels of educational attainment among female workers. The share of core working-age females in the labour force with a university degree has increased from 18 per cent in 1990 to 51 per cent in 2023. Male labour force participation rates have historically been relatively steady with a slight decline in core working-age males over the long term.
Over the outlook period, the participation rates of both male and female workers are projected to decline modestly as older workers transition to retirement.
Non-Permanent Residents in Ontario’s Labour Force
As highlighted in Chapter 1: Demographic Trends and Projections, the number of non-permanent residents in Ontario increased by over 400,000 in the last two years, reaching about 1 million. The majority of non-permanent residents now living in the province either have work permits or are allowed to work under study permits or as asylum seekers. Therefore, they likely constitute one of the fastest-growing segments of Ontario’s labour force. Non-permanent residents are by nature a transient group, but they now represent a significant proportion of the workforce in many industries in the province, notably in agriculture, retail and hospitality. Over the outlook period, the number of non-permanent residents is projected to continue increasing, but at a significantly slower pace than in the recent past.
Productivity
Labour productivity growth - defined as real GDP per hour worked - is a key measure of economic prosperity and living standards. As Ontario’s labour force growth slows over the long term, productivity growth will become an increasingly important driver of potential economic output. Growth in labour productivity is largely dependent on business investment in capital stock, the skills composition of the workforce and technological progress.
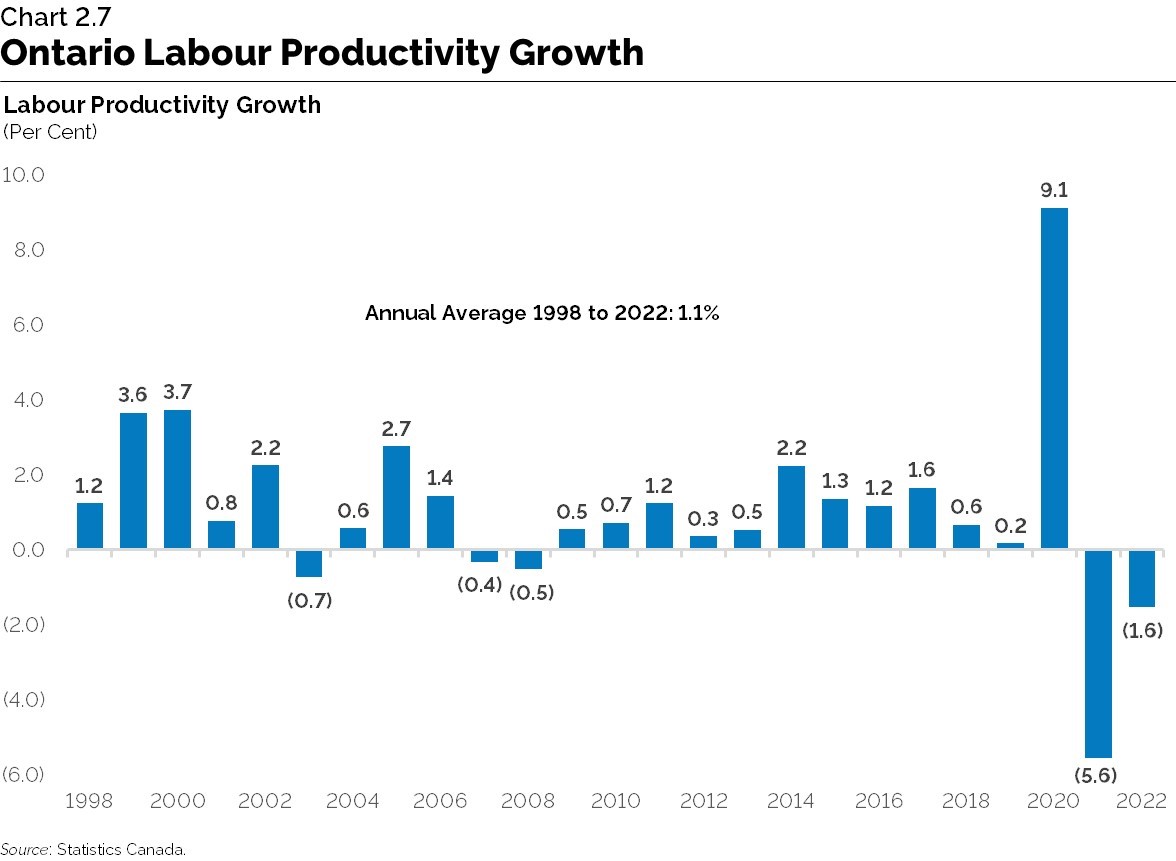
Over the past two decades, Ontario’s labour productivity has experienced periods of cyclical variation. Following a period of faster growth between 1998 to 2002, productivity advanced at a much slower pace from 2003 to 2011, due in part to rising global commodity prices, a strengthening Canadian dollar and the impact of the 2008-09 global financial crisis. Following this period, Ontario’s productivity performance improved, growing at an average annual pace of 1.0 per cent between 2012 to 2019.

The COVID-19 pandemic had an unprecedented impact on productivity growth. Early in the pandemic, hours worked declined faster than output, leading to a significant rise in productivity in 2020. As working hours recovered faster than output, productivity fell sharply in 2021 and 2022. Productivity is projected to grow at a modest pace over the medium term, before returning to its historical average of 1.1 per cent annually over the long-term projection period.
Over the long term, structural factors such as aging demographics and educational attainment could impact productivity growth. Given the inherent uncertainty of productivity projections, the implications of lower and higher rates of productivity growth for Ontario’s economy are explored through scenarios later in this chapter.
Ontario’s Long-Term Economic Growth
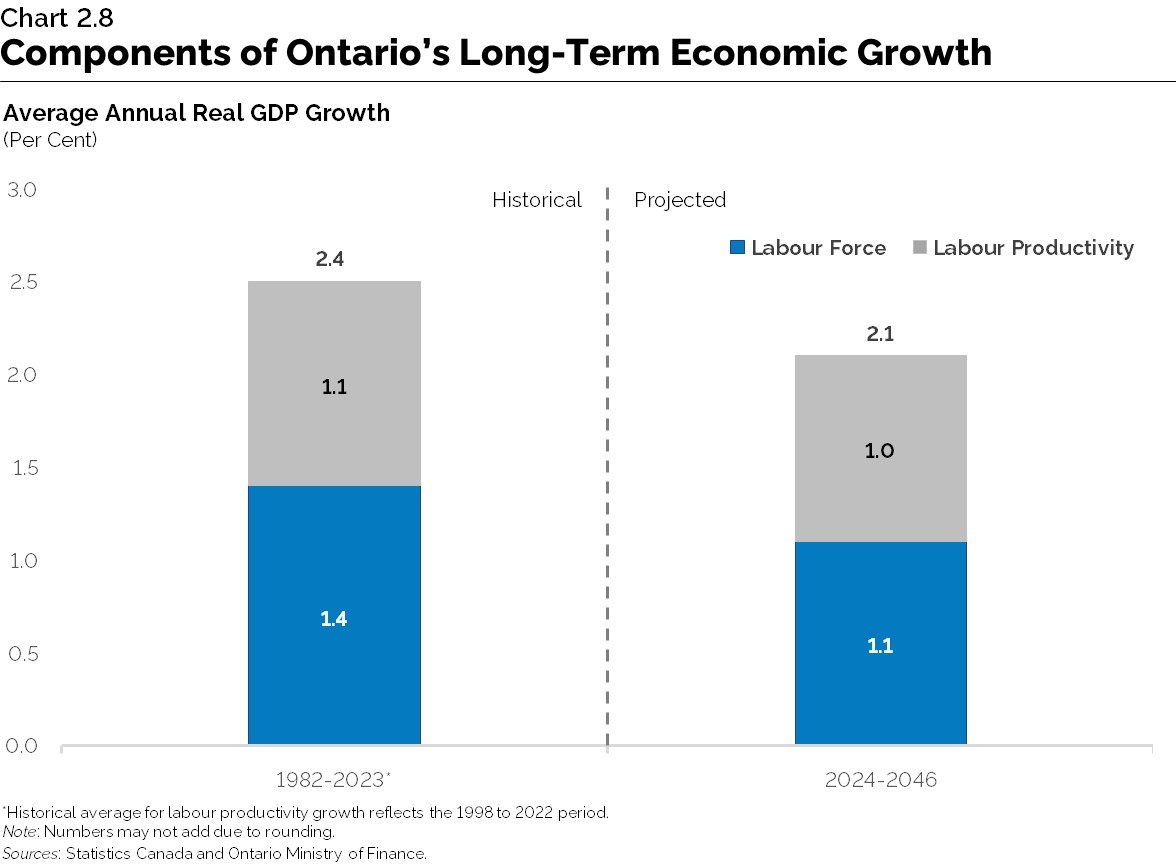
Average annual growth in potential real GDP is projected to be 2.1 per cent for Ontario, slower than the 2.4 per cent average annual growth over the 1982 to 2023 period, driven primarily by weaker long-term labour force growth. By 2046, Ontario’s real GDP is projected to be almost $1.5 trillion.
Nominal GDP is expected to grow at a slower pace over the long term as economy-wide price growth moderates. Ontario’s consumer price index (CPI) inflation is projected to ease to 2.0 per cent in 2025 and remain there over the long-term projection. The GDP deflator is projected to grow at an average of 1.9 per cent annually. Nominal GDP is expected to expand at an annual average rate of 4.0 per cent over the projection period, slower than the historical average of 5.2 per cent per year. By 2046, Ontario’s nominal GDP is projected to be around $2.7 trillion.
Comparison to the 2020 Long-Term Report on the Economy
Compared to the 2020 Long-Term Report on the Economy, average annual growth in nominal GDP over the long term is projected to be slightly higher at 4.0 per cent. This stronger nominal GDP growth is paralleled by stronger real GDP growth at 2.1 per cent, mainly attributed to stronger labour force growth driven by higher immigration. This is partially offset by slightly lower productivity growth reflecting below-average growth over the first few years of the projection. The long-term outlook for inflation continues to be anchored to the Bank of Canada’s two per cent target and remains unchanged.
Risks to the Outlook
An important risk to Ontario as a small open economy is the recent trend towards increased trade protectionism such as unresolved trade disputes between China and the United States, as well as ongoing and emerging geopolitical conflicts. These potential trade barriers also present challenges alongside a slowing global growth outlook.
Developments in artificial intelligence (AI) have the potential to automate some aspects of work currently done by human labour. This technology was initially expected to primarily affect more routine and less cognitively complex occupations, but recent advances suggest the possibility of a far wider potential impact on the labour market. This emerging technology could result in significant economic benefits but could also present challenges for some sectors. See Chapter 5: Harnessing Sector Strengths to Support Growth for more details on emerging technologies and their potential impact on Ontario.
Given that international migration is the main driver of growth in the provincial labour force, there are risks related to changes in immigration policies. The recent increases in national immigration targets and the surge in non-permanent residents over the last few years were the result of specific policies that may change further in the long term.
Alternative Scenarios
The path of long-term economic growth in Ontario is based on trends and assumptions that are subject to uncertainty and risk. The section below outlines the key risks and trends that could impact the economy, and how changes in key factors could influence Ontario’s long-term growth.
Labour Force Growth
As outlined in Chapter 1: Demographic Trends and Projections, there are potential alternative paths for population growth in Ontario. Over the long-term projection, a higher labour force growth scenario would lead to average annual real GDP growth of 2.7 per cent, and the 2046 level of real GDP would be about $1.7 trillion versus $1.5 trillion in the base case. In contrast, under a lower labour force growth scenario, real GDP growth would average 1.6 per cent annually, and the 2046 level of real GDP would be about $1.3 trillion versus $1.5 trillion in the base case.
| Long-Term Projection Lower Labour Force Growth | Long-Term Projection Base Case | Long-Term Projection Higher Labour Force Growth | |
|---|---|---|---|
| Real GDP Growth | 1.6 | 2.1 | 2.7 |
| Population Growth | 0.9 | 1.4 | 2.0 |
| Labour Force Growth | 0.6 | 1.1 | 1.7 |
Source: Ontario Ministry of Finance.

Productivity Growth
Another factor that could be different is the province’s long-run productivity growth. There have been periods when Ontario labour productivity growth experienced significant variations. Over the long-term projection, a high productivity scenario would lead to average annual real GDP growth of 2.4 per cent, and the 2046 level of real GDP would be about $1.6 trillion compared to $1.5 trillion in the base case. In contrast, under a low productivity scenario with real GDP growth averaging 1.8 per cent annually, the 2046 level of real GDP would be about $1.4 trillion compared to $1.5 trillion in the base case.
| Long-Term Projection Low Productivity | Long-Term Projection Base Case | Long-Term Projection High Productivity | |
|---|---|---|---|
| Real GDP Growth | 1.8 | 2.1 | 2.4 |
| Labour Force Growth | 1.1 | 1.1 | 1.1 |
| Labour Productivity Growth | 0.7 | 1.0 | 1.3 |
Source: Ontario Ministry of Finance.

Other Perspectives on Long-Term Growth
The projection for long-term real GDP growth presented in this chapter is broadly consistent with views from other forecasters, including the Conference Board of Canada and University of Toronto. The Ontario Ministry of Finance’s long-term projection lies within the range of these estimates.
| Real GDP | |
|---|---|
| Conference Board of Canada | 2.1 |
| Ontario Ministry of Finance | 2.1 |
| University of Toronto | 2.0 |
Sources: Policy and Economic Analysis Program, University of Toronto Long-Term Forecast (2024), Conference Board of Canada Provincial Outlook Long-Term Economic Forecast: Ontario (2024) and Ontario Ministry of Finance.
Chart Descriptions
Chart 2.1: Ontario Real GDP Recovery From Pandemic
This line chart illustrates the per cent change in Ontario’s real GDP relative to its pre-pandemic level (indexed to 2019Q4). The time period in the chart spans 2019Q4 to 2023Q4.
In 2020Q2, Ontario’s real GDP contracted 12.8 per cent from its pre-pandemic level. Ontario real GDP returned to its pre-pandemic level by 2021Q3 and was 5.5 per cent above its pre-pandemic level by 2023Q4.
Note: The latest data point is 2023Q4.
Source: Ontario Ministry of Finance.
Chart 2.2: Ontario’s Employment Recovery
This line chart shows the per cent change from peak employment by month during previous recessions in Ontario. Recession periods include 1982, 1990-91 and 1992, 2008-09 and 2020. Compared to the previous recessions, the 2020 recession had the largest contraction in employment, declining 16 per cent from its peak. However, the recovery in employment was faster and stronger than any previous recession, exceeding its pre-pandemic level by September 2021.
Note: The latest data point is March 2024.
Sources: Statistics Canada and Ontario Ministry of Finance.
Chart 2.3: Global Economic Growth Projections
This bar chart shows historical and projected average annual real GDP growth for the European Union, Advanced Economies, Canada, the United States and the world economy. Historical growth rates span the 1982 to 2023 period, while projected growth rates cover the 2024 to 2046 period.
Between 1982 to 2023, average annual real GDP growth was 1.9 per cent for the European Union, 2.4 per cent for Advanced Economies, 2.2 per cent for Canada, 2.7 per cent for the United States and 3.4 per cent for the world economy.
Over the 2024 to 2046 period, average annual real GDP growth is projected to be 1.5 per cent for the European Union, 1.7 per cent for Advanced Economies, 2.0 per cent for Canada, 2.0 for the United States and 3.1 per cent for the world economy.
Sources: International Monetary Fund (April 2024), Statistics Canada, U.S. Bureau of Economic Analysis and Ontario Ministry of Finance.
Chart 2.4: Long-Term Outlook for Crude Oil Prices
This line chart shows the nominal and real price of a barrel of West Texas Intermediate crude oil between 1986 to 2023 and 2024 to 2046. The chart also includes a vertical line separating the historical from the projection period.
The nominal price of crude oil is projected rise to about $134 US per barrel by 2046, whereas the real price of crude oil (valued in 2023 US$) is projected to reach $84 by 2046.
Sources: U.S. Energy Information Administration, U.S. Bureau of Economic Analysis and Ontario Ministry of Finance.
Chart 2.5: Stronger Labour Force Participation Among Recent Immigrants
This line chart shows labour force participation rates among recently landed immigrants to Ontario (5 or less years earlier) and those who are born in Canada. Participation rates are presented for the 25 to 54 age cohort and cover the 2006 to 2023 period.
The labour force participation rate for those born in Canada has increased from 88 per cent in 2006 to 90 per cent in 2023. Meanwhile, the labour force participation rate among recently landed immigrants has increased from 75 per cent in 2006 to 85 per cent in 2023.
Source: Statistics Canada.
Chart 2.6: Male and Female Labour Force Participation Rates
This line chart shows male and female labour force participation rates in Ontario between 1982 to 2023. The labour force participation rate for males (15 and over) has declined from 79 per cent in 1982 to 70 per cent in 2023. In contrast, the labour force participation rate for females (15 and over) has risen from 56 per cent in 1982 to 61 per cent in 2023.
Source: Statistics Canada.
Chart 2.7: Ontario Labour Productivity Growth
This bar chart shows the annual growth in Ontario’s labour productivity between 1998 and 2022. Ontario’s labour productivity grew at an annual pace of 1.2 per cent in 1998, 3.6 per cent in 1999, 3.7 per cent in 2000, 0.8 per cent in 2001, and 2.2 per cent in 2002. Ontario’s labour productivity growth declined 0.4 per cent in 2007 and 0.5 per cent in 2008. However, in the years subsequent to the 2008-2009 recession, Ontario’s productivity performance improved, reaching 2.2 per cent in 2014.
During the COVID-19 pandemic, Ontario experienced significant variations in productivity growth. In 2020, labour productivity growth rose to 9.1 per cent, before declining to 5.6 per cent in 2021 and 1.6 per cent in 2022.
Source: Statistics Canada.
Chart 2.8: Components of Ontario’s Long-Term Economic Growth
This stacked bar chart shows average annual growth rate for Ontario’s labour force, labour productivity and real GDP. The chart includes a vertical line separating the historical period of 1982 to 2023 and the projected period of 2024 to 2046.
Between 1982 and 2023, Ontario’s labour force and labour productivity expanded at an average annual rate of 1.4 per cent and 1.1 per cent, respectively. During this period, Ontario’s real GDP advanced at an average annual rate of 2.4 per cent.
Over the 2024 to 2046 period, Ontario’s labour force is projected to grow at an average annual pace of 1.1 per cent, while labour productivity and real GDP are expected to advance at 1.0 per cent and 2.1 per cent, respectively.
*Historical average for labour productivity growth reflects the 1998 to 2022 period.
Note: Numbers may not add due to rounding.
Sources: Statistics Canada and Ontario Ministry of Finance.
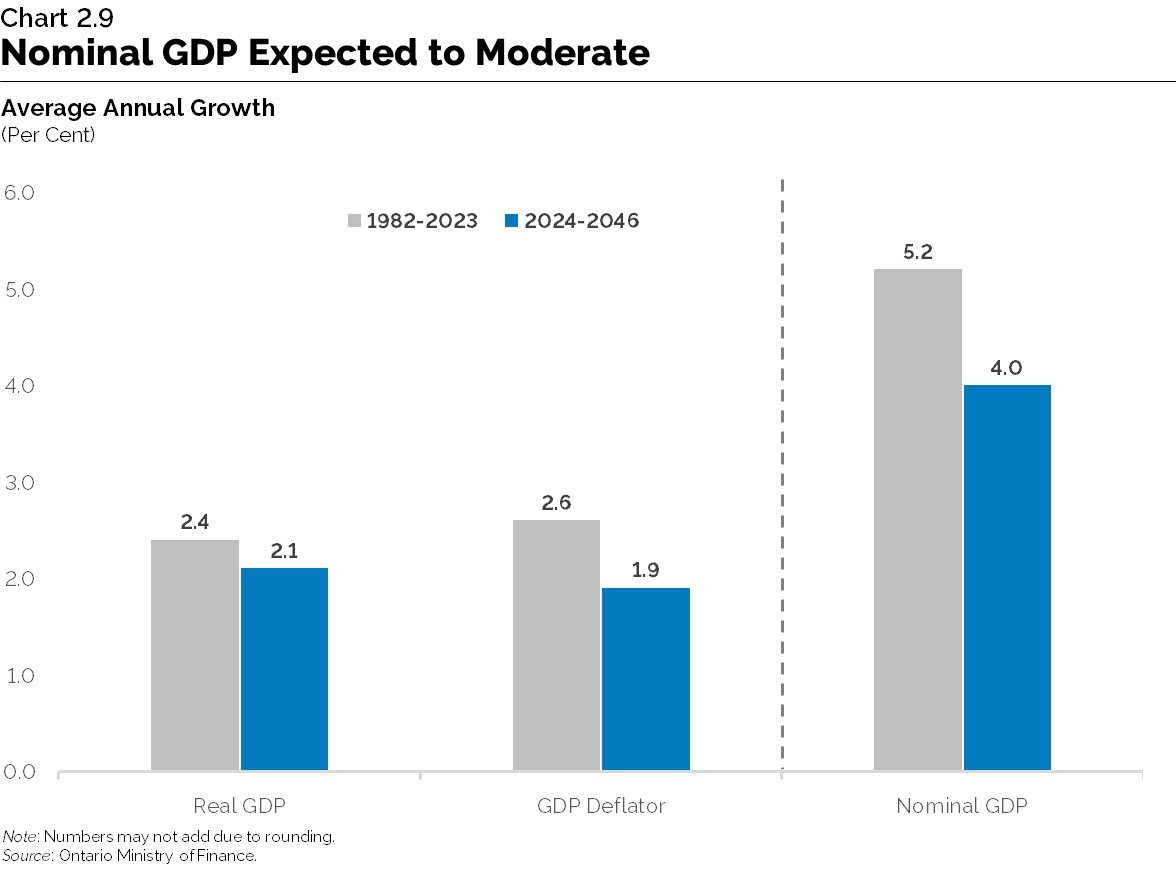
Chart 2.9: Nominal GDP Growth Expected to Moderate
This bar chart shows average annual growth in Ontario real GDP, nominal GDP and GDP deflator over the periods of 1982 to 2023 and 2024 to 2046. The chart features a vertical line separating the average annual growth rate for Ontario’s real GDP and GDP deflator from nominal GDP.
Between 1982 to 2023, Ontario’s real GDP, GDP deflator and nominal GDP advanced at an average annual pace of 2.4 per, 2.6 per cent, and 5.2 per cent, respectively. Over the projection period of 2024 to 2046, real GDP is expected to grow at an average annual pace of 2.1 per cent, while the GDP deflator is projected to grow at 1.9 per cent. Nominal GDP is projected to grow at an average rate 4.0 per cent annually over the projection.
Note: Numbers may not add due to rounding.
Source: Ontario Ministry of Finance.
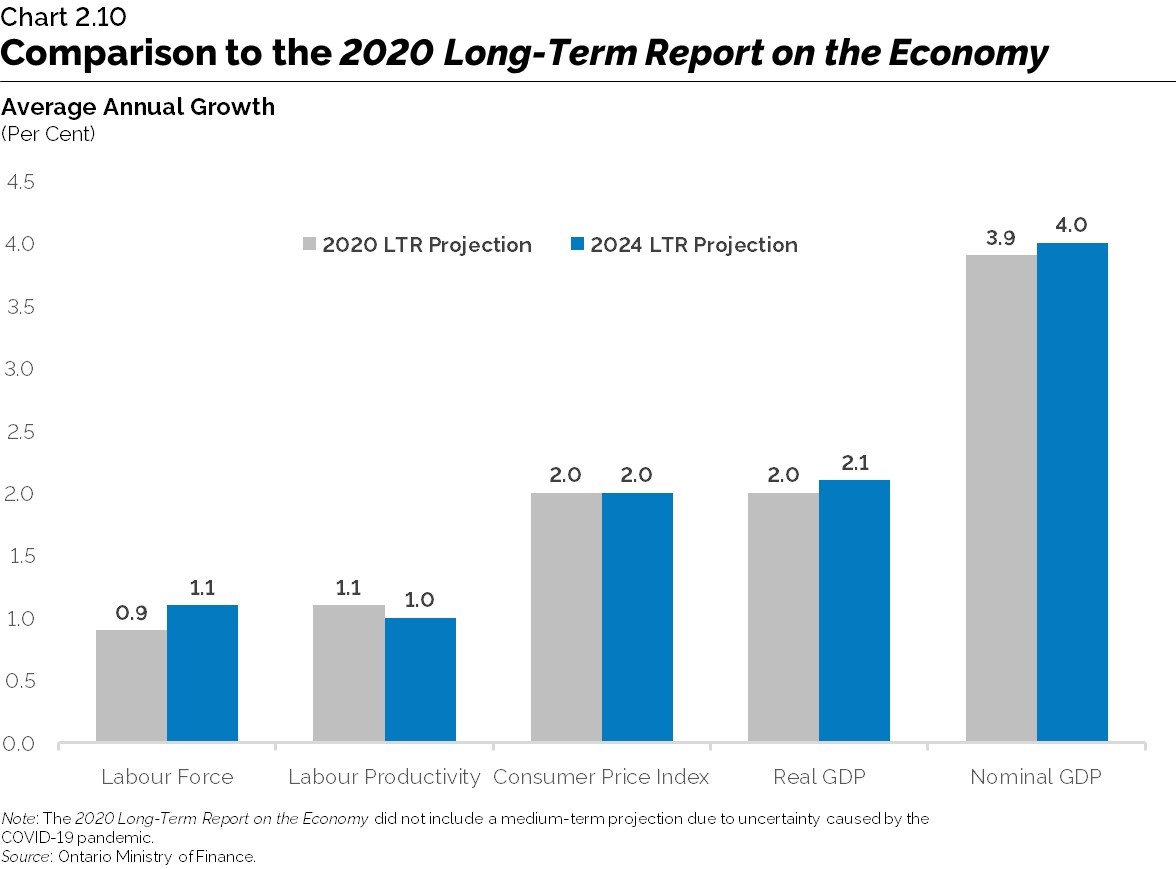
Chart 2.10: Comparison to the 2020 Long-Term Report on the Economy
This bar chart shows projected average annual growth rates for Ontario’s labour force, employment, labour productivity, consumer price index, real GDP and nominal GDP. These long-term projections are presented for the 2020 Long-Term Report and the 2024 Long-Term Report.
In the 2020 Long-Term Report, Ontario’s labour force was projected to grow at an average annual pace of 0.9 per cent, with labour productivity growing at 1.1 per cent, consumer price index at 2.0 per cent, real GDP at 2.0 per cent and nominal GDP at 3.9 per cent.
In the 2024 Long-Term Report, Ontario’s labour force is projected to grow at an average annual pace of 1.1 per cent, with labour productivity growing at 1.0 per cent, consumer price index at 2.0 per cent, real GDP at 2.1 per cent and nominal GDP at 4.0 per cent.
Note: The 2020 Long-Term Report on the Economy did not include a medium-term projection due to uncertainty caused by the COVID-19 pandemic
Source: Ontario Ministry of Finance.